
Figure 8. Behavioral visual thresholds measured in white, red and green light, respectively, in transgenic zebrafish after metronidazole treatments.
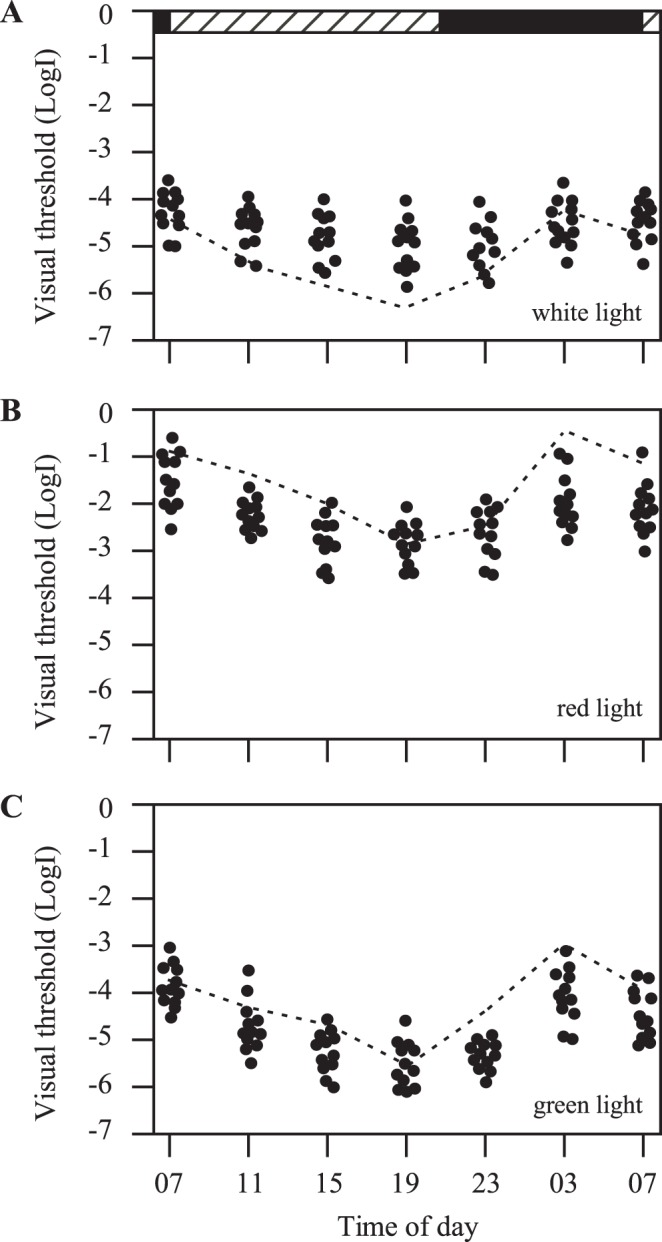
Each circle represents a visual threshold measurement from one fish (n = 12). When measured with white light, visual thresholds increased in most times of the day and night, except at 3 and 7am, at which times the thresholds were already at the highest levels (A). Under red and green light illumination conditions, visual threshold decreased in the day and night, except 7pm, at which time the thresholds were already at the lowest levels (B, C). Dashed lines represent visual thresholds obtained from untreated control fish. Horizontal hatched and black bars on the top of the panel represent subjective day and night, respectively.