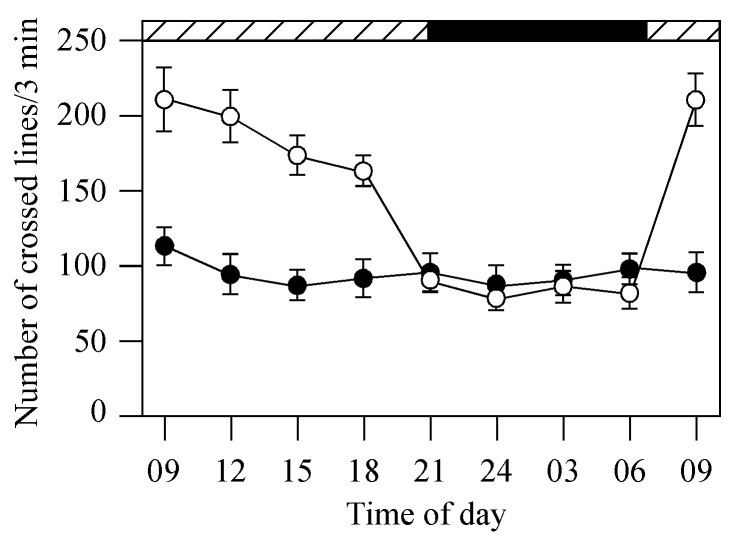
Figure 9. Locomotor activities of control (untreated transgenic fish; white circles, n = 12) and metronidazole-treated transgenic fish (black circles, n = 12) at different times of the day and night in DD.
In the control group, the fish were more active in the day than in the night. In metronidazole-treated fish, swimming activities were similar in the day and night. Horizontal hatched and black bars on the top of the panel represent subjective day and night, respectively. Data represents the Means ± SE.

