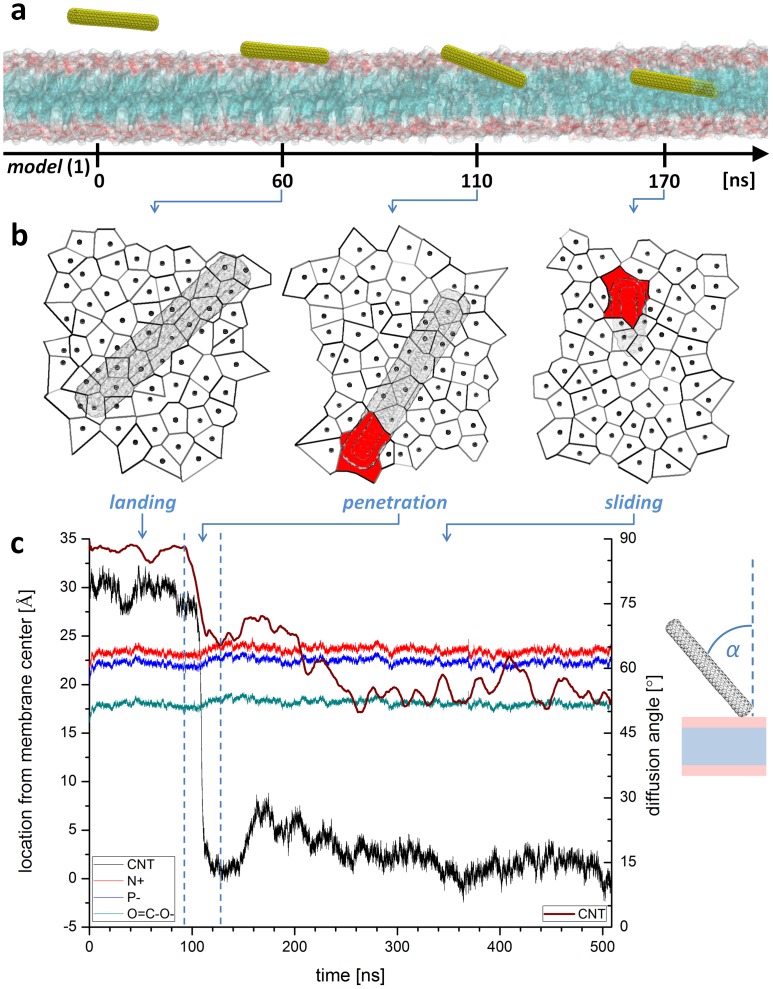
Figure 2. Uptake path of model (1) SWNT.
a, Internalization mechanism obtained from unconstrained MD simulations with closed and non functionalized SWNT displays a 3-step passive diffusion phenomenon. The lipid membrane head and tails sections are shown as red and blue surfaces, respectively. For clarity, water molecules and counterions are not shown. b, Voronoi tessellations of membrane surface present in average an inflation of the area per lipid but reveals also local contractions in the neighborhood of the tube penetrating the membrane. Red areas in Voronoi diagrams correspond to internalizing SWNT. c, Close examination of SWNT trajectory (black curve) and insertion angle (wine curve) show sudden penetration phase. Left ordinate scale refer to SWNT center of mass position (black curve), mean nitrogen position of lipid headgroups (red curve), mean phosphorous position of lipid headgroups (blue curve) and mean position of lipid glycerol backbone (green curve). Right ordinate scale refers to SWNT insertion angle (α) with respect to the normal of the membrane plane (wine curve). The angle curve is smoothed by averaging the angle value in 1 ns window.

