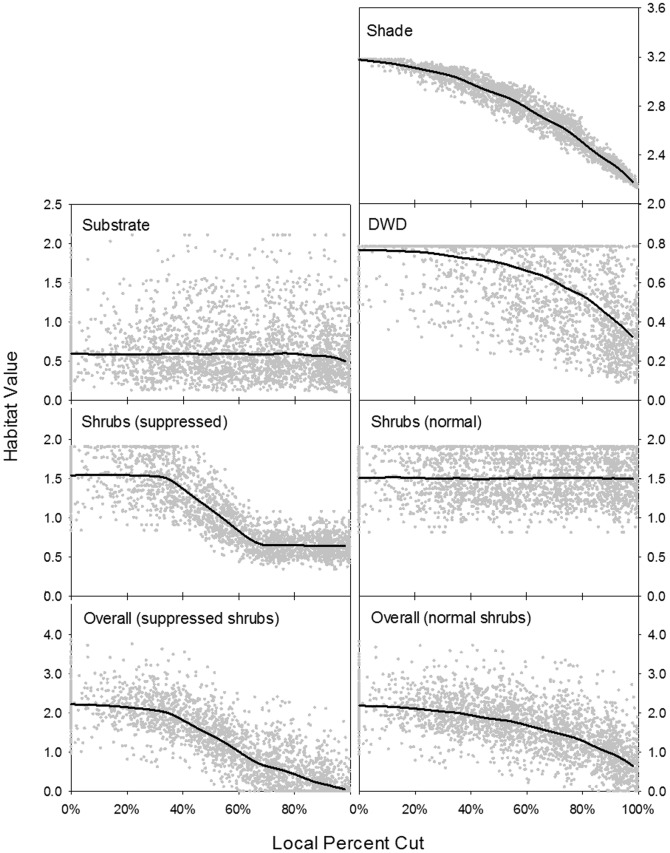
Figure 4. Simulated value of habitat components as a function of local intensity of partial harvesting.
Shrub cover and overall habitat value are presented for both the normal and suppressed shrub development scenarios (see text for details). Solid black lines indicate habitat trends derived from LOESS regression.

