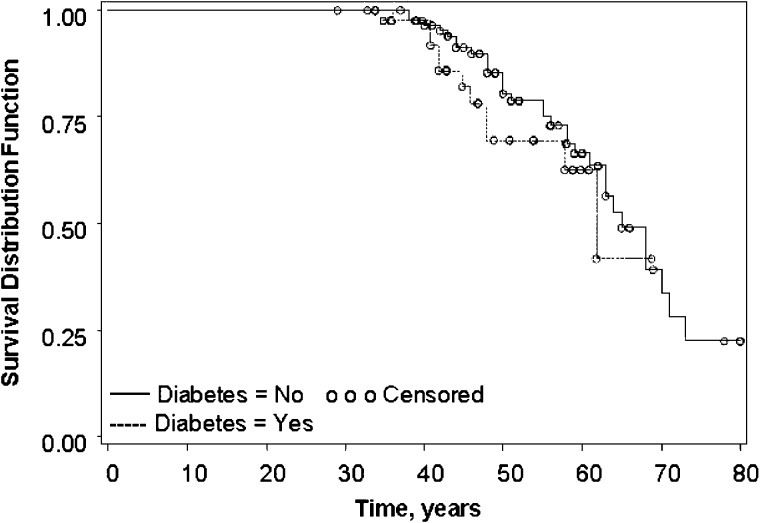
Fig. 2.
Time to onset of ESRD. From left of figure, dashed line represents ADPKD with diabetes and solid line represents ADPKD no diabetes. Open circles represent censored values in Kaplan–Meier analysis. There was no significant difference in time to onset of ESRD between patients with ADPKD and diabetes [63 (49 to no upper limit) and those with ADPKD alone [65 (61–71) years], P = 0.92.

