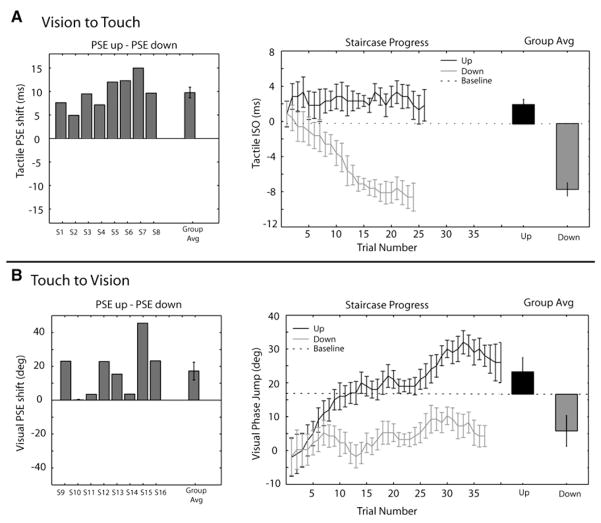
Figure 2. Results of Experiments 1 and 2.
(A) Experiment 1 Results. Left: The point of subjective equality (PSE) was measured for each subject and condition, and the magnitude of the aftereffect was quantified as the difference in tactile PSE between adapting to upward and downward visual motion. The PSE shift is shown for each subject and the group average. Right: The average threshold estimation staircase across observers is plotted for upward (gray) and downward (black) visual motion-adaptation conditions. The y axis shows the tactile test stimulus setting, measured by the interstimulus onset (ISO) between the tactile bars. Positive values indicate upward tactile motion and negative values indicate downward tactile motion. Baseline PSE (dotted line) for the tactile stimulus without prior visual motion is also shown (see Supplemental Data). Adjacent to the average staircase data, the group average upward and downward component PSE shifts are plotted relative to baseline.
(B) Experiment 2 Results. Left: The point of subjective equality (PSE) was measured for each subject and condition, and the magnitude of the aftereffect was quantified as the difference in visual PSE between adapting to upward and downward tactile motion. The PSE shift is shown for each subject and the group average. Right: Average threshold estimation staircase shown for tactile adaptation upward (gray) and downward (black). The y axis shows the phase jump in degrees from 180, where 0 degrees is a perfect counterphase grating, positive degree jumps indicate upward visual motion, and negative degree phase jumps indicate downward visual motion. Baseline PSE (dotted line) for the visual stimulus without prior tactile motion is also shown (see Supplemental Data). Adjacent to the average staircase data, the group average upward and downward component PSE shifts are plotted relative to baseline. All error bars reflect within-subject standard error [39]

