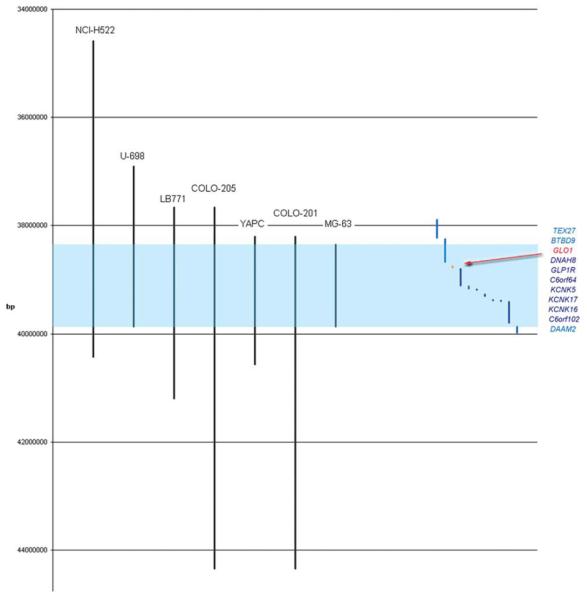
Figure 1.
Schematic representation of the amplicon located on 6p21.2 as determined by the affymetrix 10K array screen of 975 human cancer samples. The vertical axis represents the genetic distance in base pairs (bp). The black vertical lines represent regions of amplification (three-fold or greater) of individual cancer samples. Light blue is shaded the minimum common amplified region (MCAR). On the right are plotted genes that map either completely of partially outside the MCAR (light blue) or into the MCAR (dark blue). GLO1 is marked in red. [Color figure can be viewed in the online issue, which is available at www.interscience.wiley.com.]

