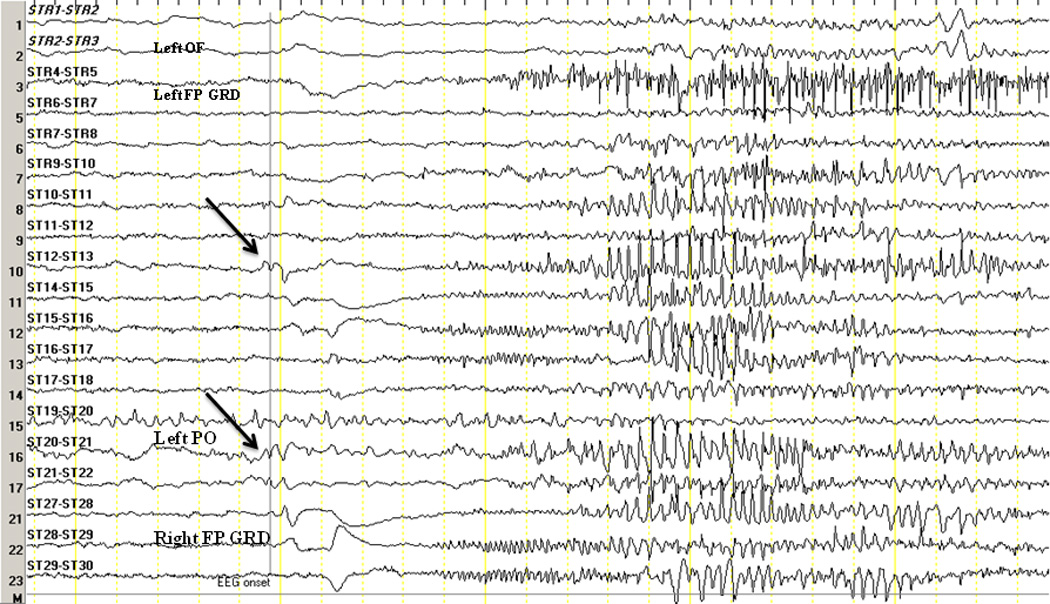
Figure 3. EEG Onset of a GTCS in B6.

The arrows indicate EEG onset characterized by an initial transient in the right parietal region (ST13/21). OF orbitofrontal depth electrode, FP GRD frontoparietal grid, PO parieto-occipital strip. The left-sided grid was not connected at the time.
