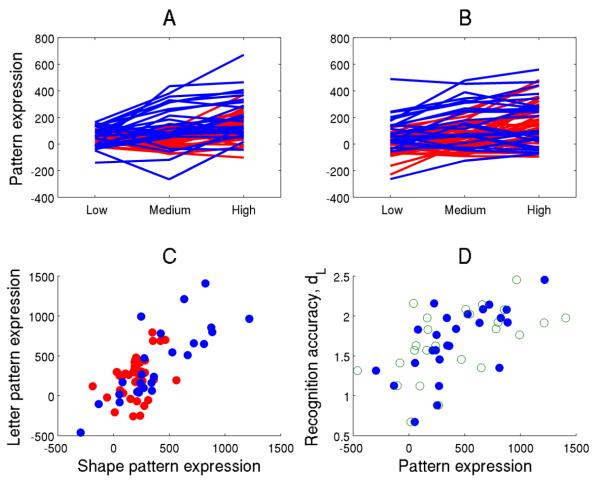
Figure 1.
Illustration of the similarity of the neural substrates of Letter and Shape rehearsal. All neural data presented in this figure pertain to task-phase RET. For panels a-c, any score obtained from an application of a pattern to the Shape data is color-coded as blue; any pattern score obtained from an application to the Letter data is color-coded as red. A: subject expression of the load-related Shape pattern in the Shape and Letter data as a function of memory load. Expression values for each participant are connected by lines to represent the ties in the data. A significant Ordinal Trend was detected in both Shape and Letter data with p=0.006 and p=0.0003, respectively. B: subject expression of load-related Letter pattern. Here, also an Ordinal Trend was verified for both Shape and Letter data at p=0.0021 and p=0.001, respectively. C: mean expression of the load-related Shape pattern across all load levels (x-axis) against the corresponding expression of the load-related Letter pattern (y-axis), both in the Shape and Letter data. Expression values of both patterns were positively correlated in both data sets: greater usage of the Shape pattern was associated with greater usage of the Letter pattern hinting at functional similarity. Correlation values and p-levels of both pattern scores for the Shape and Letter data were R2=0.62 (p=2 e-6) and R2=0.15 (p=0.02), respectively. D, filled circles: mean expression of both rehearsal-pattern scores in Shape data against the corresponding discriminability measure dL: greater subject expression of the Shape pattern in the Shape data correlates with better behavioral performance (R2=0.42, p=0.0005). Open circles: similar brain-behavioral correlation, but for the expression of the Letter pattern. Greater expression of the Letter pattern in the Shape data also correlates with better discrimination performance (R2=0.30, p=0.0043), even though the Letter pattern was derived from a different task and subject sample.

