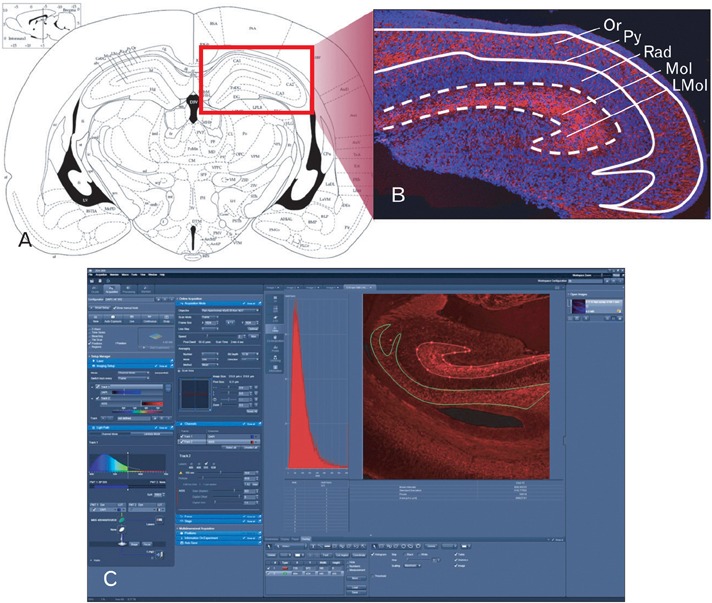
Fig. 1.

Confocal densitometric analysis methods for the morphological quantification of synaptophysin in the mice hippocampal region (hippocampus and subiculum proper). (A) Diagram of coronal thin section (10 µm) of the mouse brain. Hippocampal areas in red rectangular region were used for confocal microscopic analysis. (B) Confocal image of coronal sectioned hippocampal region. Synaptophysin volume data were obtained by analyzing this image using the system calculating penetration ratio of light intensity into optical density values. Optical density measurement was obtained by manually positioning the area (white dashed square, superficial molecular layer [Mol] and lacunosum molecular layer [LMol]; white straight square, deep oriens layer [Or]) of immunofluorescence-stained section. (C) ZEN 2009 (ver. 5,5,0,375, Carl Zeiss) software used for image acquisition and analysis. The synaptophysin densities were assayed in relation to the areas outlined, and results were appeared on the analysis software (C). Py, pyramidal cell layer; Rad, radiatum layer.
