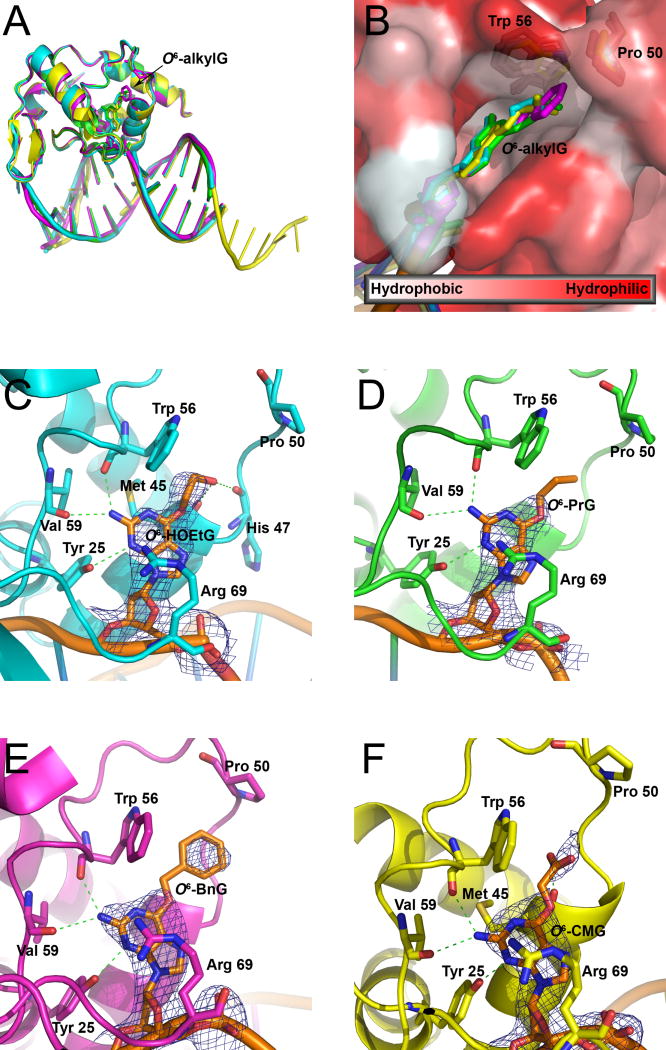
Figure 5. Crystal structures for Atl1 in complex with ODN containing O6-HOEtG (cyan) O6-PrG (green), O6-BnG (magenta), or O6-CMG (yellow).
(A) Structural overlay of Atl1:ODN complexes showing similar DNA bend.
(B) Molecular surface of Atl1 lesion-binding pocket colored by hydrophobicity (white=most hydrophobic; red=least hydrophobic) and overlaid with Atl1:ODN complex structures. Trp 56 and Pro 50 are shown for reference.
(C–F) Binding of O6-HOEtG (C), O6-PrG (D), O6-BnG (E), and O6-CMG (F) within the Atl1 binding pocket. 2Fo-Fc omit electron density (blue) is shown for each O6-alkylG adduct (orange). Hydrogen bonds are shown as dashed green lines. The accompanying crystallographic data are listed in Table 1.

