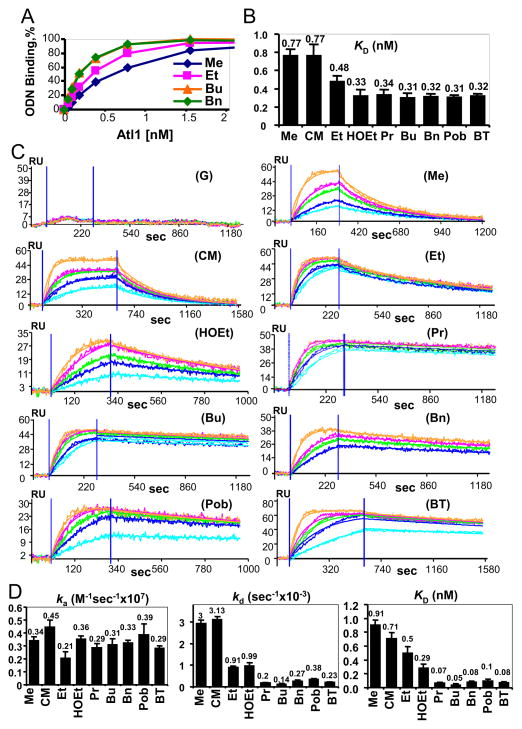
Figure 6. Quantitative assessment of the binding of Atl1 to ODN by ELISA and SPR.
(A) Direct ELISA: effect of incubation of increasing concentrations of Atl1 with ODN duplexes bound via 5′-terminal biotin to SA-coated plates; typical binding curves.
(B) IC50 values extrapolated from the direct ELISA curves.
(C) SPR sensograms for the indicated ODN.
(D) SPR-determined interaction constants ka (association ‘on’ rate), kd (dissociation rate) and KD (dissociation constant). Values are means of at least triplicate determinations and error bars indicate standard error of the mean.

