
Figure 5.
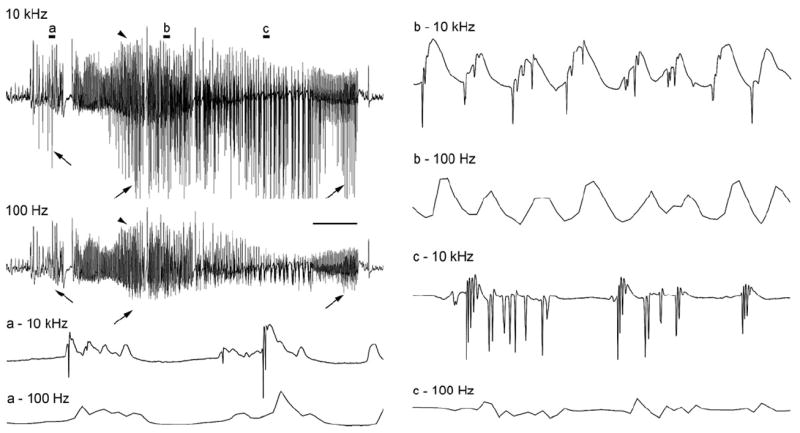
A spontaneous electrographic seizure recorded from the dentate granule cell layer of an awake rat 2 days after 3 hr of stimulation-induced status epilepticus. This first spontaneous granule cell-onset seizure was recorded at two acquisition rates (10 kHz and 100 Hz) simultaneously to illustrate the loss of high frequency data at the lower acquisition rate. Note that presentation of the recording at a compressed timescale (top left) makes it appear that both recordings are similar superficially. However, even at this compression, it can be seen that the slower 100 Hz recording lacks the negative-going population spikes (arrows). Conversely, the slower positive-going potentials are recorded by both methods (arrowheads). Expansion of the recordings clearly shows the selective loss of all high frequency data at the 100 Hz rate, making it impossible to know if population spikes (synchronous granule cell discharges) are present. Scale bar: 4 sec in the compressed traces and 60 msec in traces a-c.