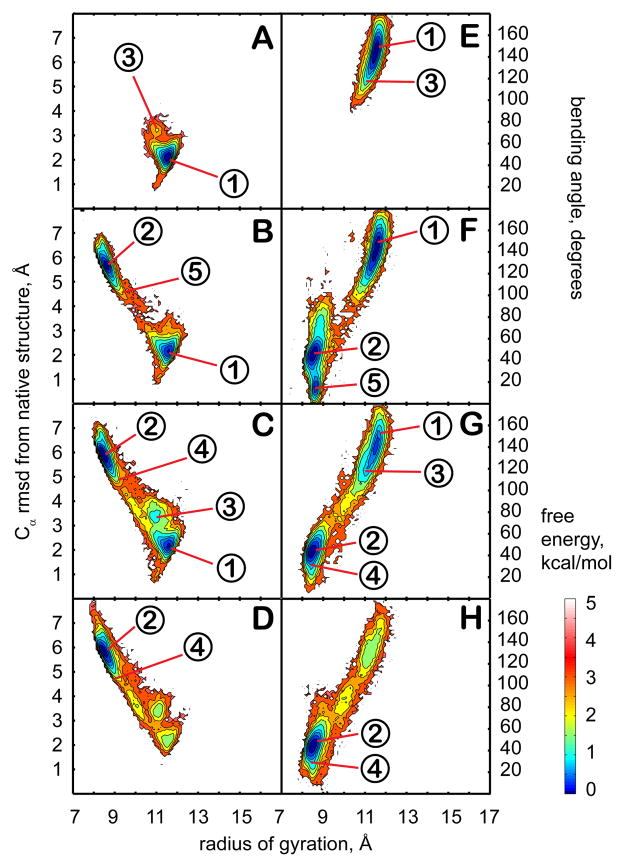
Figure 6.
Conformational sampling of melittin in different dielectric environments with ε = 5 (A,E), ε = 20 (B,F), ε = 40 (C,G), and ε = 80 (D,H). The underlying data was published earlier46. The analysis shown here is based on the replicas at 300K during the interval of 7.5 to 75 ns. Plots on the left (A–D) show the PMF at 300 K as a function of the radius of gyration and the Cα RMSD from the minimized native structure. Right plots (E–H) show the PMF at 300K as a function of the radius of gyration and the bending angle between N- and C-terminal parts of the structure. Contour levels and cluster centers are as in Fig. 2.

