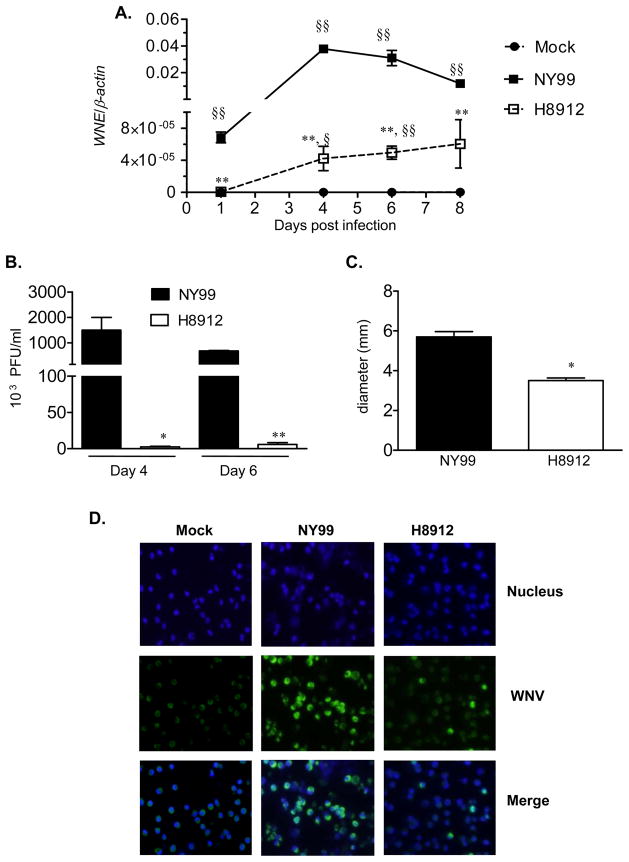
Fig.1.
Comparison of infection between WNV H8912 and WNV NY99 in mouse macrophage cells. Mouse macrophage cells were infected with both WNV strains at an MOI of 1. A, Q-PCR was used to measure WNV infection in cell lysates. B-C, Supernatant was collected to measure viral titer (B) and plaque size (C) by plaque assay. D, Immunofluorescence photomicrographs of macrophage cells at day 4 after infection. Cells were stained with antibody to WNV antigen (green signal). Hoechst dye was used as a nuclear counterstaining (blue signal), and merged images are shown. **P < 0.01 or *P < 0.05 for NY99 vs. H8912. §§ P < 0.01 or §P < 0.05 for WNV-infected vs. mock. P values were calculated with a non-paired Student’s t test.

