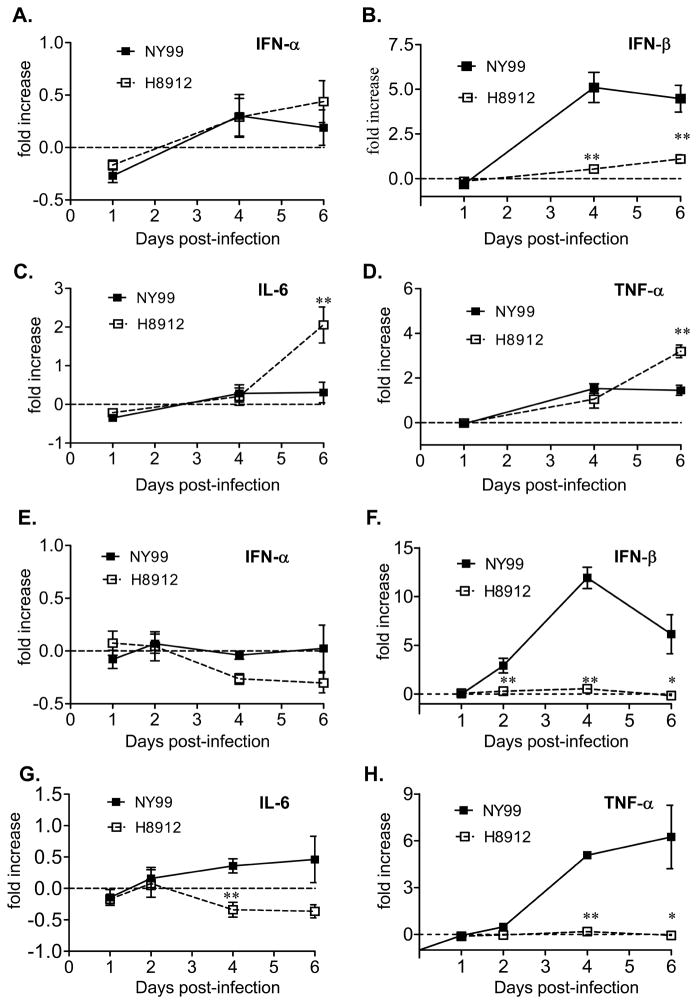
Fig. 3.
Innate cytokine gene expression in mouse macrophages and kidney epithelial cells following infection with WNV H8912 and WNV NY99. Cytokine levels in macrophages (A-D) and kidney epithelial cells (E-H) were determined using Q-PCR at various time intervals post-infection. Fold of increase compared to mock-infected group was shown. **P < 0.01 or *P < 0.05 for WNV NY99 vs. WNV H8912. P values were calculated with a non-paired Student’s t test.

