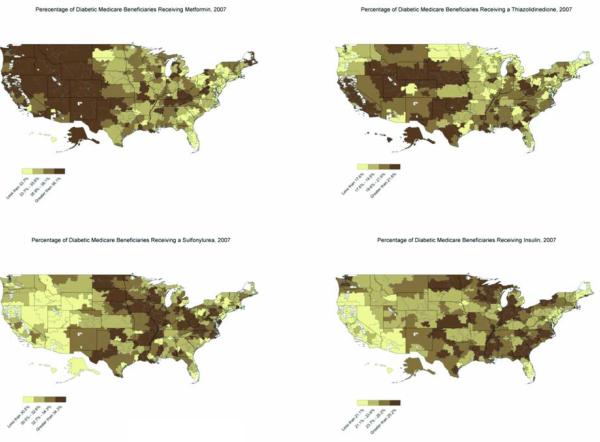
Figure 1. Prescription Patterns for Diabetic Medications Received by U.S. Medicare Beneficiaries, 2007.
Figure 1 illustrates regional variation in the prescription rates of metformin, sulfonylureas, thiazolidinediones, and sulfonylureas for the year 2007. These maps show the percentage of diabetic patients in each of the 306 hospital referral regions receiving a particular drug class. Patients receiving combination therapy were counted as receiving multiple diabetic medications. The heaviest use of metformin was observed in western states while prescription rates for sulfonylureas and insulins were increased in the South and Midwest. In contrast with these medications, provider utilization of thiazolidinediones was highest in the central United States in a region that included the Colorado Rockies, Great Plains, northern Texas, and Oklahoma.

