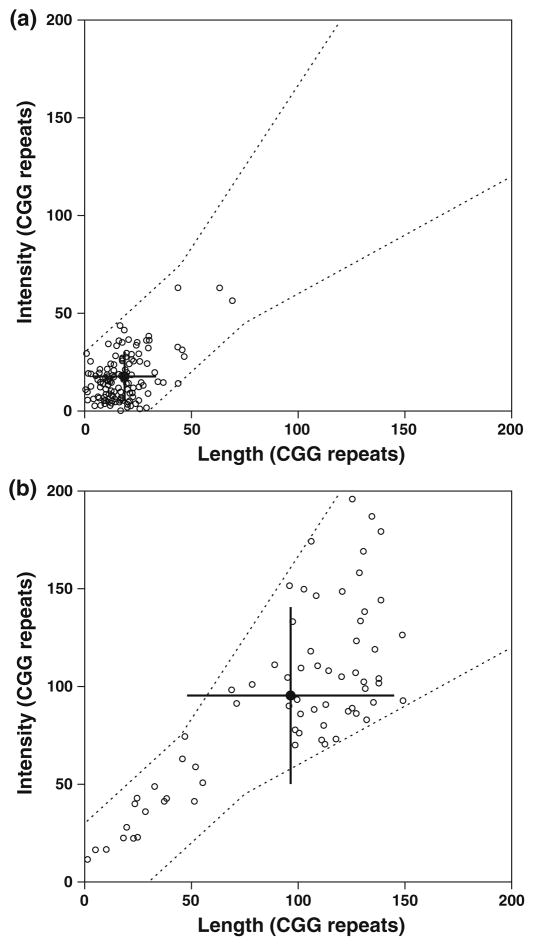
Fig. 4.
Scatter plots showing the distribution of the measured CGG repeat sizes for a (CGG)23 and b (CGG)118, in which the length-derived measurements correspond to the x-axis and the dye-counting measurements correspond to the y-axis. The filled symbol indicates the average of the two measurements. The error bars show the standard deviations. The averages of the correlated molecules are similar to the expected values. For (CGG)23, 151 of the 206 (73.3%) analyzed molecules had correlated length and dye-count measurements, as indicated by the boundaries defined by the dashed lines. Data that gave uncorrelated measurements, falling outside of this boundary, were rejected from further analysis and are therefore not included in the plots. For (CGG)118, 93 of 231 (40.2%) of the analyzed molecules had correlated length and dye-count measurements. These values are consistent with the expected fraction of correlated molecules between the two measurements for (CGG)23 and (CGG)118 with 71.6 and 42.9%, respectively. The true-negative values by the dye-counting and length measurements were 92.8 and 77.2%, respectively. The true-positive values by the dye-counting and length measurements were 54.6 and 78.0%

