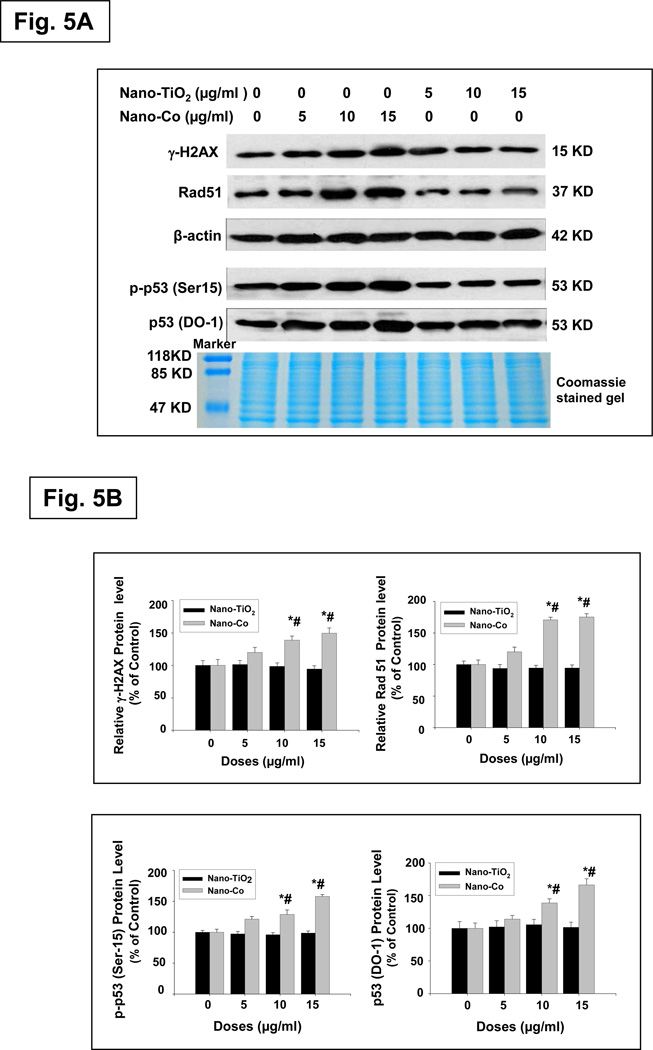
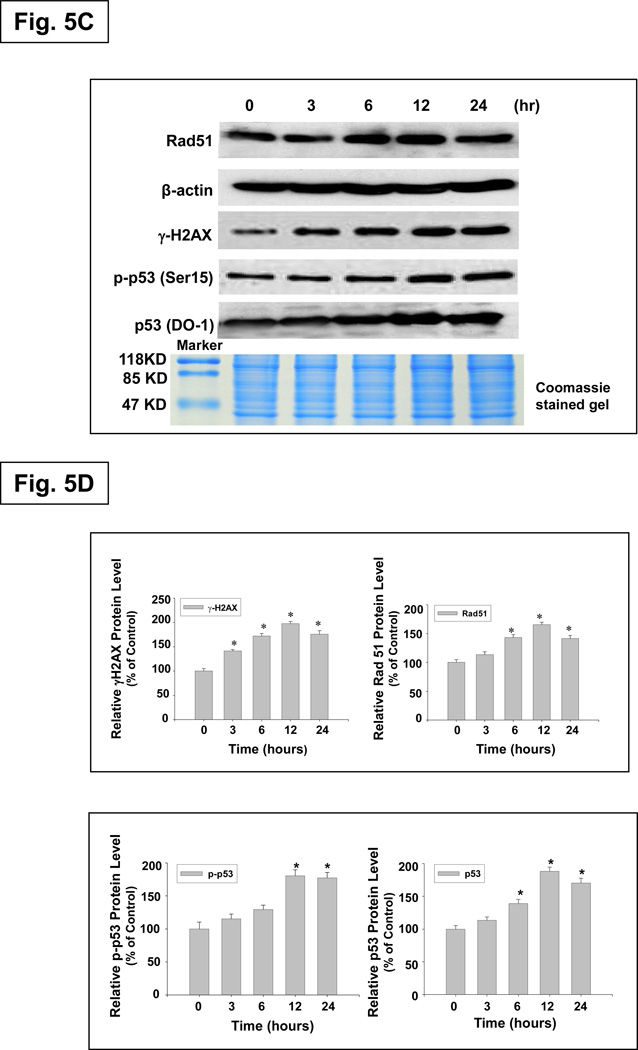
Fig. 5. Dose- and time- response induction of γ-H2AX at Ser 139, Rad51, p-p53 at Ser 15 and p53 expression in A549 cells exposed to Nano-Co.
Cells were treated with 0, 5, 10 and 15 µg/ml of Nano-Co or Nano-TiO2 for 12 h (A & B) or with 15 µg/ml of Nano-Co for 0, 3, 6, 12 and 24 h (C & D). Cells without treatment were used as control. Cytosolic protein (for Rad51 and β-actin) or nuclear protein (for γ-H2AX, p-p53 and p53) was prepared for Western blot. A and C were results of a signal Western blot experiment, while B and D were normalized band densitometry readings averaged from 3 independent experiments ± SE of Western results. β-actin or Coomassie blue stained gel was used for verification of equality of lane loading. * Significant difference as compared with the control, p < 0.05; # Significant difference as compared with the same dose of Nano-TiO2-treated group, p < 0.05.


