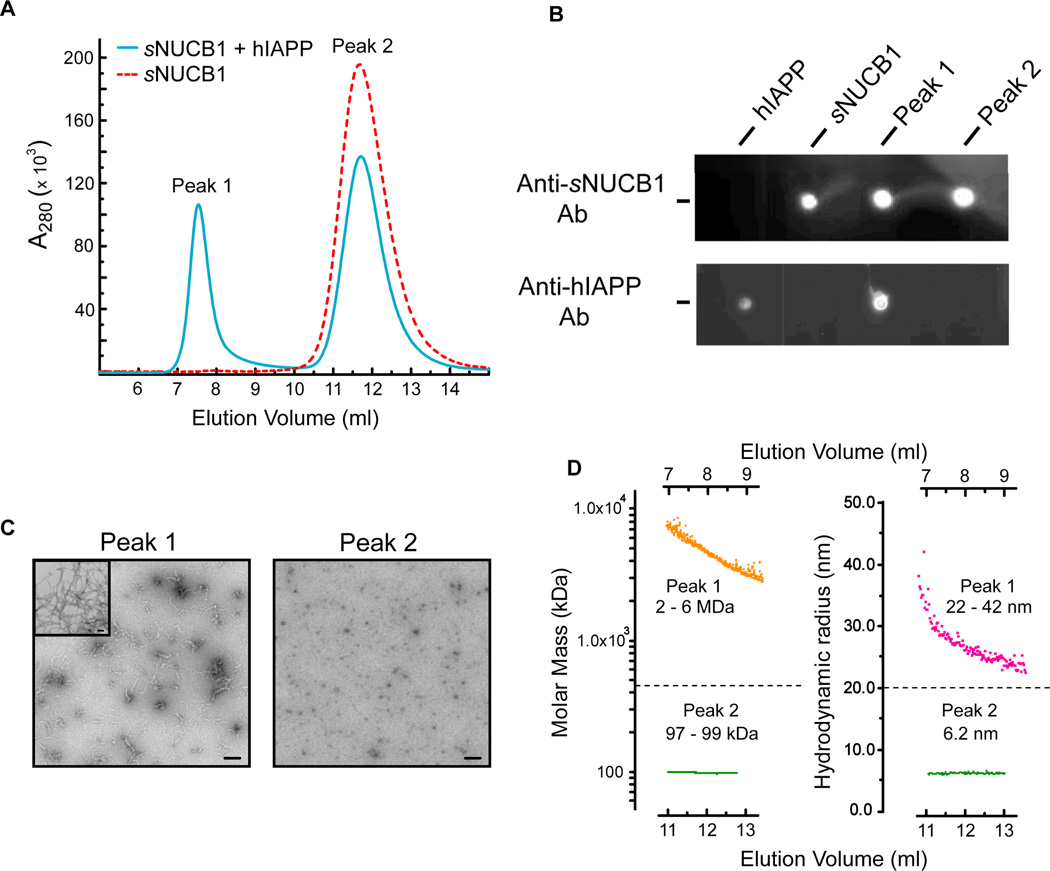
Figure 5. Biophysical characterization of Ca2+-free sNUCB1 stabilized hIAPP prefibrillar species.
(A) SEC was used to analyze the products of the 1:1 mixture of hIAPP and Ca2+-free sNUCB1. Ca2+-free sNUCB1 alone elutes at 12 ml (red dotted curve) while the sample from a 1:1 reaction mixture removed after 60 min gives an additional peak, Peak1, eluting at 7.8 ml. (B) Dot-blot assay shows that sNUCB1 is present in both peaks, hIAPP is only present in the Peak 1 fraction. (C) TEM analysis of the Peak1 fraction shows the presence of oligomeric and prefibrillar species whereas no higher order aggregates were observed in the Peak 2 fraction. Insert: TEM image of fibrils alone. (D) MALS analysis (left) across Peak1 estimates the molecular mass in the range of 2 – 6 million Da and DLS (right) predicts hydrodynamic radii in the range of 22 – 42 nm. MALS and DLS analysis of Peak2 predicts a molecular mass and hydrodynamic radii characteristic for a dimer of sNUCB1.

