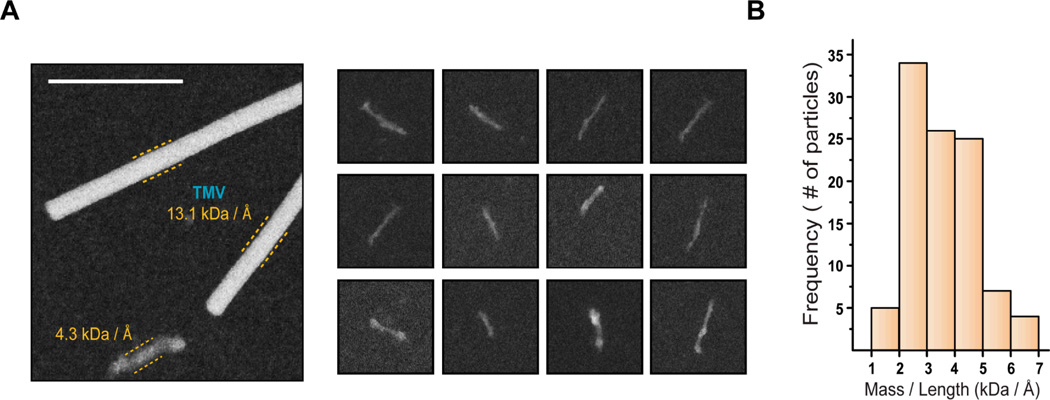
Figure 6. sNUCB1 stabilizes hIAPP protofibrillar species.
STEM was used to determine the mass / unit length (M / L) distribution of prefibrillar species in the Peak1 fraction. (A) The image shows a typical dark-field cryo-STEM image of the Peak1 fraction. The adjacent panel shows images representing prefibrillar species observed in STEM. The scale bar or width of each box represents 100 nm. (B) Quantitative analysis shows the presence of prefibrillar species with M / L ranging from 1 – 7 kDa / Å with the predominant species ranging from 2 – 5 kDa / Å.

