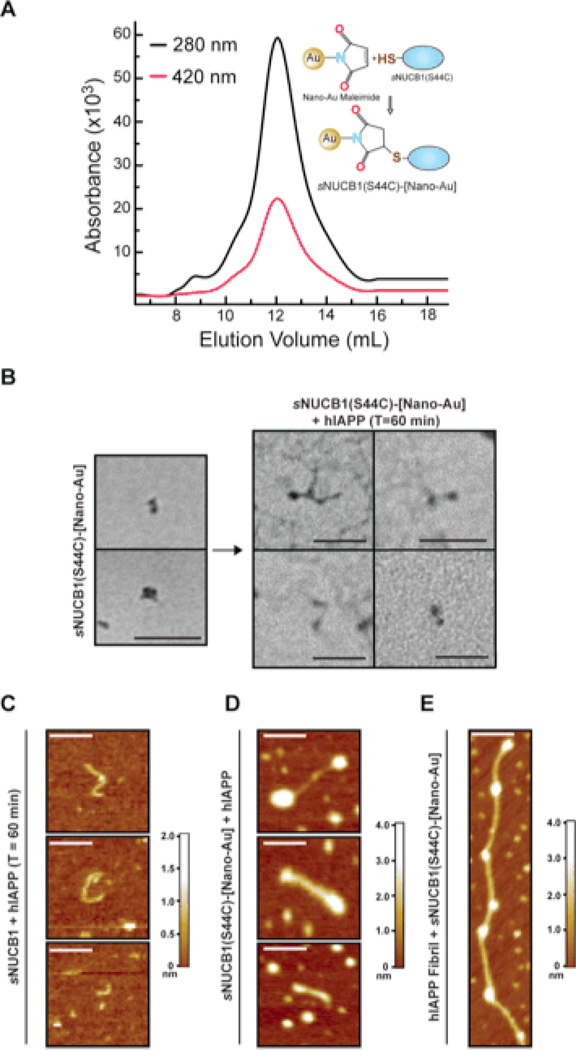
Figure 7. Nano-Au labeled sNUCB1(S44C) “caps” hIAPP prefibrillar species.
(A) Nano-Au labeled sNUCB1(S44C) was purified via SEC. The chromatogram shows the co-elution of the 280-nm protein peak (black) and the 420-nm nano-Au peak (red). The inset shows a schematic of the conjugation reaction that covalently links the nano-Au to a Cys residue. (B) TEM analysis of the labeled sample shows the presence of two typical nano-Au densities corresponding to a dimer of a labeled sNUCB1(S44C). Nano-Au labeled sNUCB1(S44C) was incubated with equimolar hIAPP for 60 min after which samples were withdrawn. TEM analysis shows the presence of high molecular mass prefibrillar species with labeled ends. The scale bar represents 100 nm. AFM in non-contact mode was used to corroborate the TEM studies. (C) The micrographs reveal sNUCB1 stabilized hIAPP prefibrillar species with the height of prefibrillar species varying from 1.0 to 2.0 nm. The inhibition reaction was repeated using purified sNUCB1(S44C)-[Nano-Au]. (D) AFM images confirm that sNUCB1(S44C)-[Nano-Au] caps the ends of prefibrillar species of hIAPP. The presence of Nano-Au clusters was confirmed by increase in height of the ends of these prefibrillar species. (E) AFM micrographs show hIAPP protofibrils studded with sNUCB1(S44C)-[Nano-Au]. The image illustrates the interaction of sNUCB1(S44C) with preformed protofibrils of hIAPP. The scale bar in each AFM image represents 100 nm. The color contour scale on the right of each AFM panel represents the height of each sample in nm. AFM images of mature fibrils are included in the supporting information.

