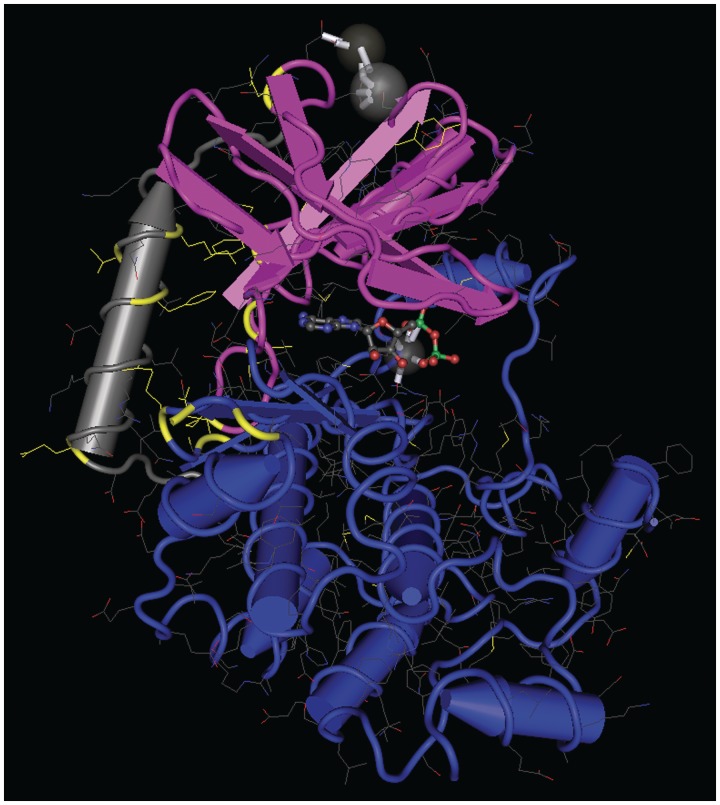
Figure 2:
A 3D model of MEK 1 showing a mutational hot spot. A 3D X-ray model of residues 35–382 of MEK 1 in a binary complex with ADP and Mg2+ [29] rendered in worms with Cn3D software was used to map the locations of syndromic and cancer-related mutations as well as germline variants. The model is oriented with the small amino-terminal catalytic lobe colored pink at the top and the large catalytic lobe in blue at the bottom. ADP and Mg2+ are shown in the cleft between the two lobes. The amino terminus is represented on the left in grey. Mutated residues are indicated in yellow.

