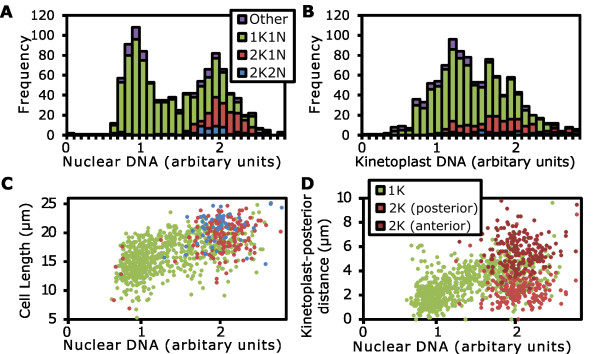
Figure 7.
Automated analysis of procyclic Trypanosoma brucei DNA content, shape and organelle positioning. Logarithmically growing procyclic T. brucei were analyzed using 4', 6-diamidino-2-phenylindole (DAPI) and SYBR green staining followed by color deconvolution and automated image analysis of DNA content and morphology. (A) Histogram of the nuclear DNA content of cells broken down by kinetoplast and nucleus number; 1K1N (green), 2K1N (red), 2K2N (blue) and other (purple). (B) Histogram of the kinetoplast DNA content of cells broken down by kinetoplast and nucleus number as in (A). (C) Scatter plot of cell length against nuclear DNA content for 1K1N, 2K1N and 2K2N cells, color coded as in (A). (D) Scatter plot of kinetoplast position against nuclear DNA content. Points are shown in green for cells with a single kinetoplast and red for cells with two kinetoplasts. The more posterior kinetoplast in 2K cells is shown in the lighter shade of red.

