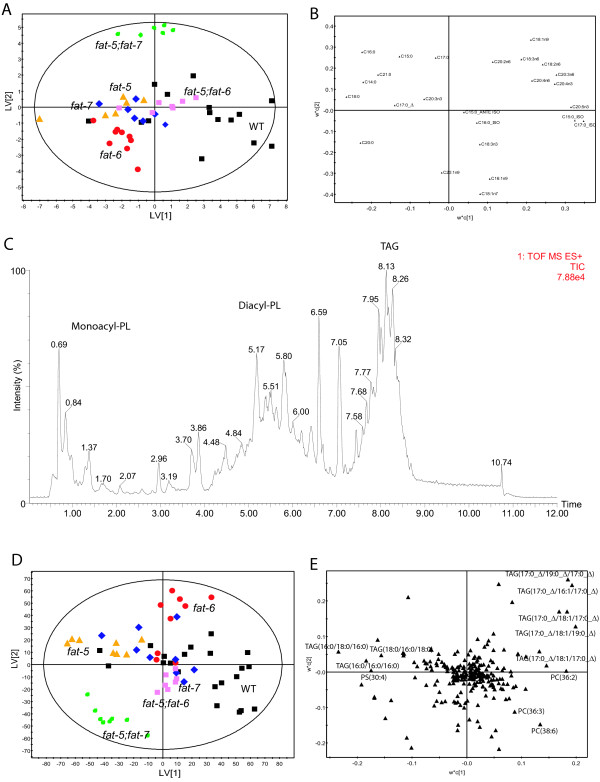
Figure 3.
Analysis of the lipid phase of the extracts. (A) Score plot of PLS-DA following MSCA filter on the total fatty acid content as measured by GC-FID analysis of all strains. For the meaning of the symbols see key in Figure 2C. (B) Loading plot of PLS-DA model in A. (C) Lipid chromatogram for a selected illustrative sample of the lipid fraction obtained by reversed phase Ultra Performance Liquid Chromatography coupled to high resolution Mass Spectrometry (positive ion mode). Key: PL: PhosphoLipids; TAG: Triacylglycerols. (D) Score plot of PLS-DA following MSCA filter on the UPLC-MS experiments on the intact lipid phases of all strains. For the meaning of the symbols see the key in Figure 2C. (E). The loading plot of the PLS-DA model in D.

