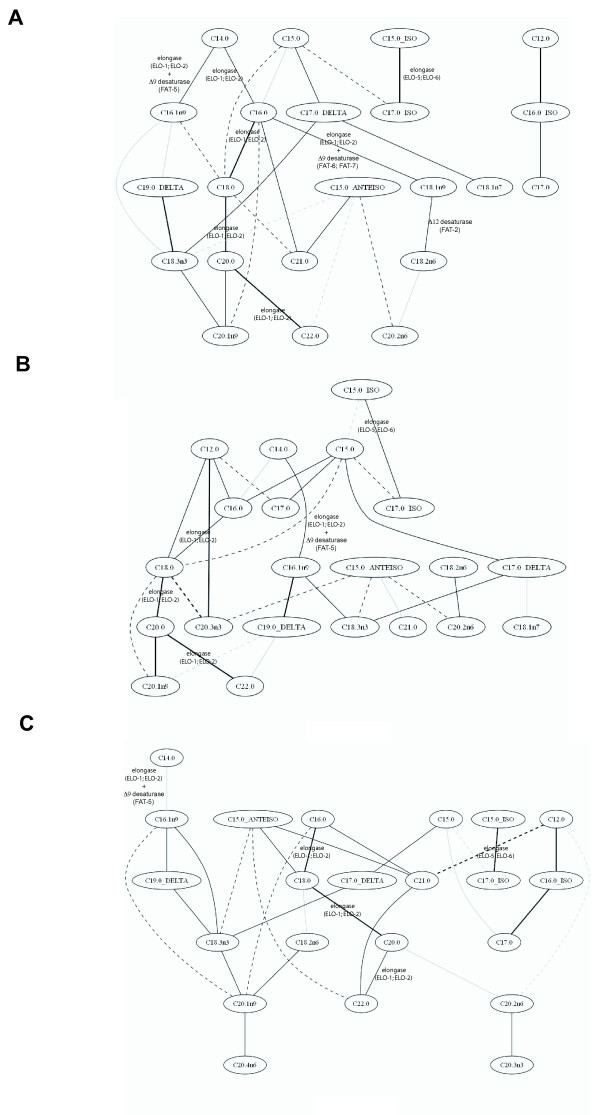
Figure 4.
Graphical Gaussian Model obtained considering the 30 highest partial correlation coefficients from the results of the GC-MS experiments on the lipid fraction to measure total fatty acid content. (A) The network calculated considering the fatty acid concentrations in all the strains. The network was also calculated considering wild type and fat-6 mutant (B) alone, and wild type and fat-7 mutant (C) alone. The straight lines represent positive partial correlation coefficients between the fatty acids, while dotted lines represent negative partial correlation coefficients. The intensity of the line is proportional to the intensity of the correlation.

