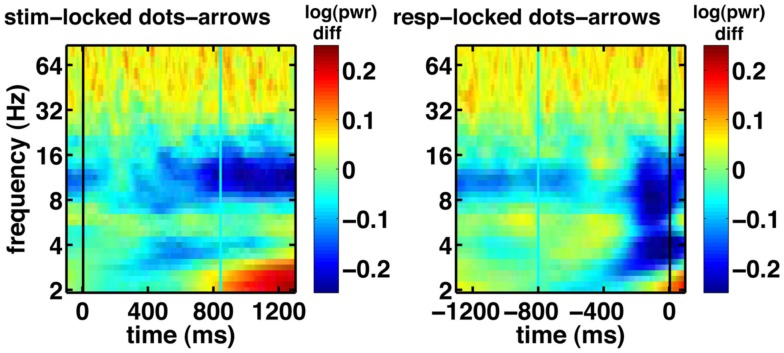
Figure 7.
Basic electrophysiological data for electrode FPz. Black line indicates the event to which the data are aligned (onset of dot-motion for the stimulus-locked graphs and the response for the response-locked graphs). Cyan line indicates the average response time and stimulus onset time, respectively. These are difference spectrograms contrasting the integration and non-integration conditions. Left column: stimulus-locked. Right column: response-locked.

