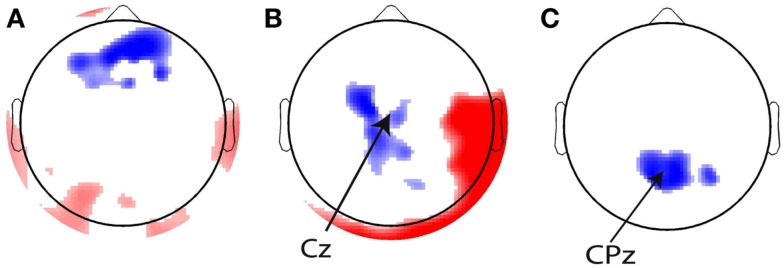
Figure 8.
Topographical overviews of the 10% most significant electrodes for the (A) eye blink, (B) stimulus, and (C) response regressors. Red and blue reflect positive and negative regression weights, respectively, and the intensity of the shading indicates the magnitude of the regression weights. The most significant electrodes are in the locations from which the regressors were generated [indicated with arrows in (B,C)].

