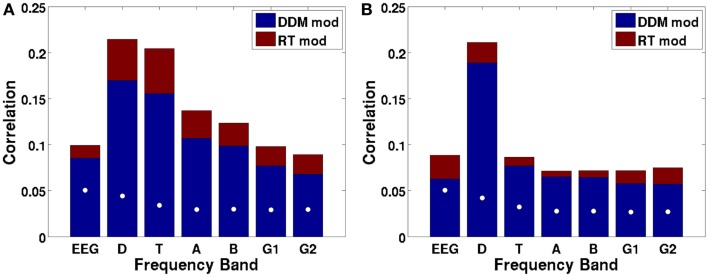
Figure 9.
Canonical correlations as a function of frequency, with the DDM-modulated model in blue and additional correlation achieved by the RT-modulated model in red, shown separately for the ramp regressor of (A) dots (integration condition) and (B) arrows (non-integration condition). White dots indicate the 97.5th percentile of the distribution of canonical correlations expected based on random regressors. Letters indicate frequency bands: EEG = raw EEG, D = 2–4 Hz delta, T = 4–9 Hz theta, A = 9–14 Hz alpha, B = 14–28 Hz beta, G1 = 28–48 Hz low gamma, and G2 = 48–90 Hz high gamma.

