
Figure 4.
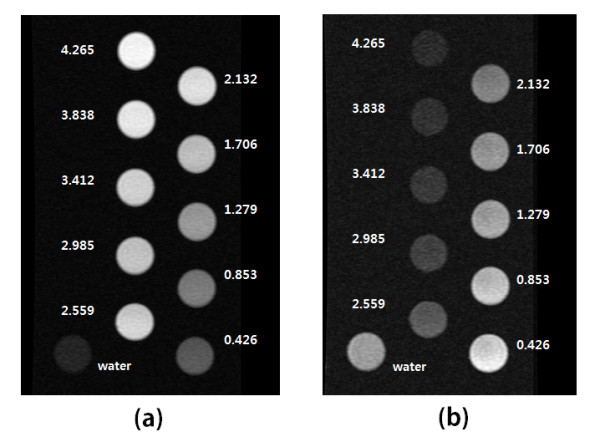
MR images for T1 (a) and T2 (b) measurements, respectively. The circular images in the picture are MR images of aqueous samples of varying concentrations with the units of mM. While a dose-dependent increase in signal intensity is seen in the T1 measurements, a dose-dependent decrease in signal intensity is observed in the T2 measurements.