
Figure 4.
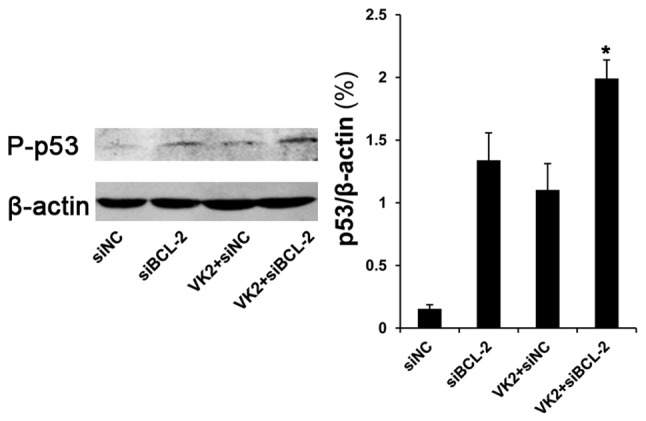
Phosphorylation of p53 expression in SMMC-7721 tumor cells. Western blot analysis of P-p53 (Ser 20) protein expression at 24 h following co-treatment. Bar: average band density of quantified P-p53 protein following normalization by the internal control β-actin. *P<0.05, as compared with VK2 and the siBCL-2 group.