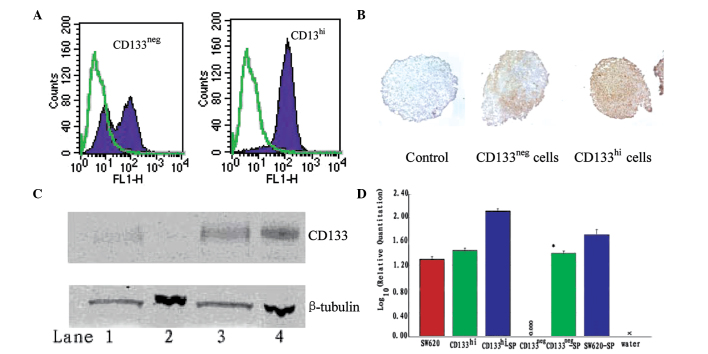
Figure 3.
CD133 expression in CD133neg and CD133hi SW620 cell spheroids. (A) Within each cell line, spheroids were pooled and disrupted into single cell suspensions. CD133 reactivity was assessed by FACS. Solid purple, CD133; green overlay, negative control. (B) Immunohistochemical staining of CD133 in spheroids. Brown, CD133; blue, nuclear stain; magnification ×200. (C) CD133 protein expression in spheroids compared with cell monolayers by western blot analysis. Upper panel, CD133 reactivity; lower panel, β-tubulin reactivity. Lane 1, CD133neg spheroids; lane 2, CD133neg cell monolayers; lane 3, CD133hi spheroids; lane 4, CD133hi monolayers. (D) Expression of CD133 by qRT-PCR, standardized to CD133 expression of CD133neg monolayer culture cells. *P<0.05 compared with CD133neg monolayer culture cells. SP, spheroid; FACS, fluorescence-activated cell sorting; qRT-PCR, quantitative real time-PCR.

