
Figure 1.
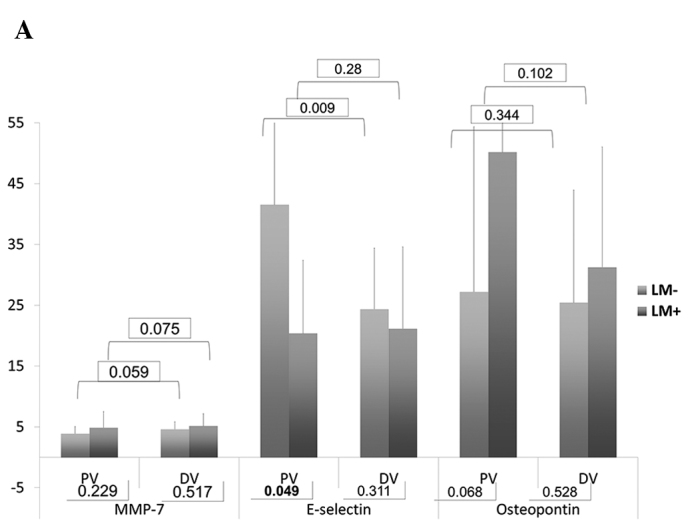
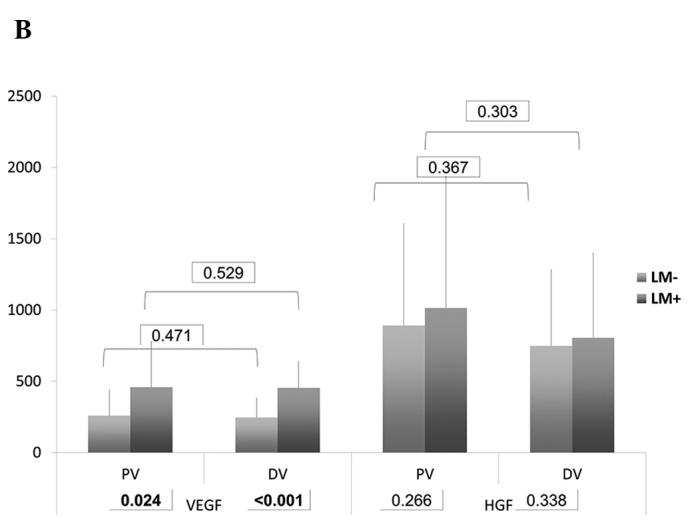
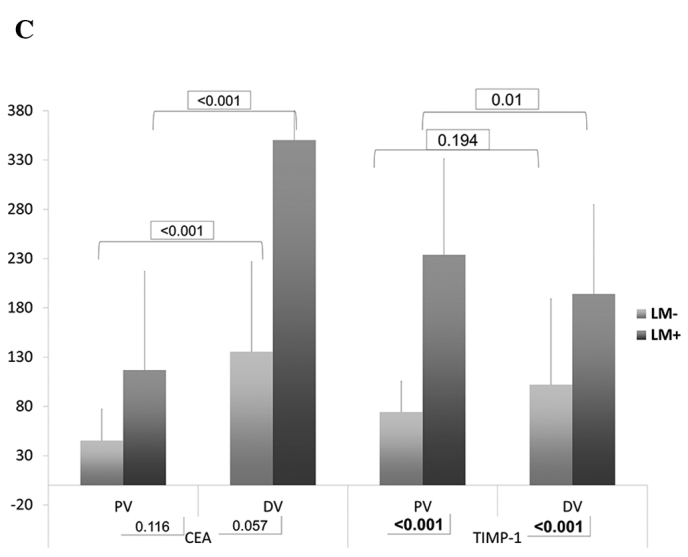
(A) Bar chart of serum levels of MMP-7, E-selectin and osteopontin. (B) Bar chart of serum levels of VEGF and HGF. (C) Bar chart of serum levels of CEA and TIMP-1. Numbers in rectangles are the P-values.
Official websites use .gov
A
.gov website belongs to an official
government organization in the United States.
Secure .gov websites use HTTPS
A lock (
) or https:// means you've safely
connected to the .gov website. Share sensitive
information only on official, secure websites.
(A) Bar chart of serum levels of MMP-7, E-selectin and osteopontin. (B) Bar chart of serum levels of VEGF and HGF. (C) Bar chart of serum levels of CEA and TIMP-1. Numbers in rectangles are the P-values.