
Figure 2.
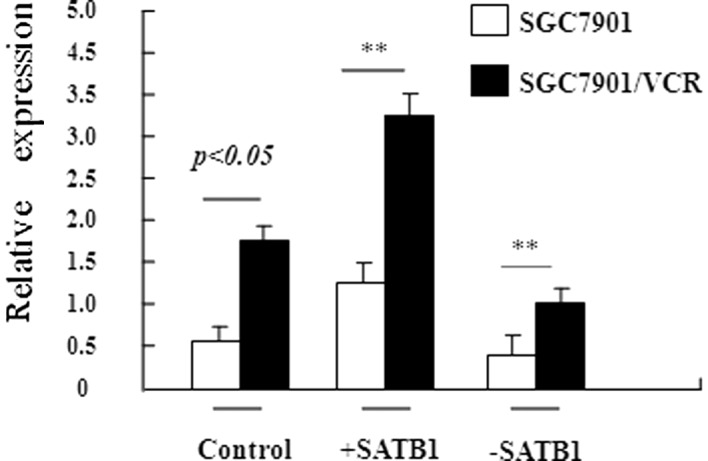
Relative expression level of SATB1 in SGC7901 cells and its variants. RT-PCR analysis revealed the relative SATB1 mRNA levels in different SGC7901-derived cell lines. GAPDH served as an internal control. The data are shown as the mean ± SD from three independent experiments. **P<0.05, SGC7901 cells vs. SGC7901/VCR cells. The data are shown as the mean ± SD from three independent experiments. +SATB1, cells transfected with SATB1 expression plasmid; -SATB1, cells transfected with SATB1-specific siRNA; SATB1, special AT-rich sequence binding protein 1; VCR, vincristine.