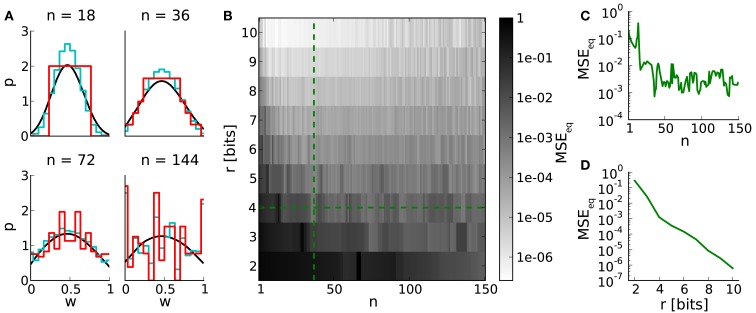
Figure 4.
Equilibrium weight distributions (long-term weight evolutions) for configurations of STDP on discrete weights. (A) Equilibrium weight distributions for weight resolutions of r = 4 bits (red) and r = 16 bits (cyan). Both distributions are displayed in 4-bit sampling, for better comparison. Black curves depict the analytical approach. We have chosen j = 105 iterations for generating each discrete weight distribution to ensure convergence to the equilibrium state. (B) Mean squared error MSEeq between the equilibrium weight distributions for weight resolutions r and the reference weight resolution of 16 bits versus the number n of SSPs. (C,D) Cross sections of (B) at r = 4 bits and n = 36, respectively.

