Figure 6.
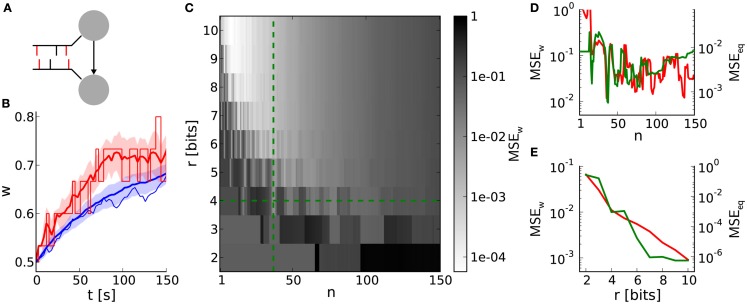
Weight evolution of a single synapse with discrete weights. (A) Network layout for single synapse analyses. An STDP synapse (arrow) connects two neurons receiving correlated spike trains with correlation coefficient c (correlated spikes in red bars). (B) Example weight traces for the hardware-inspired (r = 4 bits, n = 36 in red) and reference synapse model (blue). Means and standard deviations over 30 realizations are plotted as bold lines and shaded areas, respectively. The single weight traces for one arbitrarily chosen random seed are depicted as thin lines. We applied a correlation coefficient c = 0.2, an initial weight w0 = 0.5 and firing rates of 10 Hz. The results persist qualitatively for differing values staying within biologically relevant ranges (not shown here). (C) Mean squared error MSEw between the mean weight traces as shown in (A) over the weight resolution r and the number n of SSPs. The parameters c, w0, and the firing rates are chosen as in (B). Other values for c and w0 do not change the results qualitatively. (D,E) Cross sections of (C) at r = 4 bits and n = 36 in green. Red curves are adapted from Figures 4C,D.

