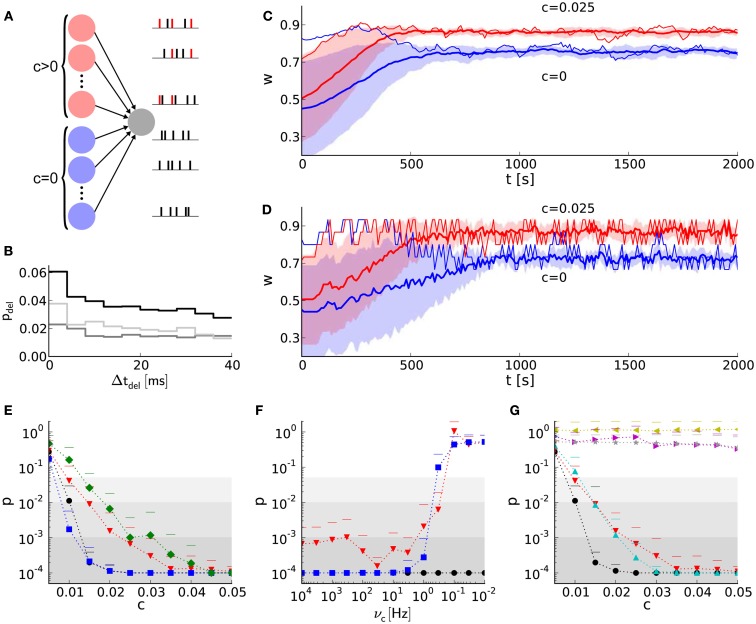
Figure 7.
Learning with discrete weights in a neural network benchmark for synchrony detection. (A) Layout of the network benchmark. Two populations of presynaptic neurons are connected to a postsynaptic neuron. On the right, example spike trains of the presynaptic neurons are shown. Red spikes indicate correlated firing due to shared spikes. (B) PSTH for static synapses and STDP reference synapses. The light gray histogram shows the difference between a simulation with STDP reference synapses (black) and static synapses (dark gray). (C) The mean weight traces (thick lines) and their standard deviations (shaded areas) for both populations of afferent synapses using the reference synapses model. Thin lines represent single synapses randomly chosen for each population. (D) As in (B), but with the hardware-inspired synapse model (r = 4 bits and n = 36). (E) The probability (p-value of Mann–Whitney U test) of having the same median of weights within both groups of synapses (with correlated and correlated input) at t = 2,000 s versus the correlation coefficient c. The hardware-inspired synapses model is represented in red (r = 4 bits and n = 36), green (r = 4 bits and n = 36) and blue (r = 8 bits and n = 12). Black depicts the reference synapse model (r = 64 bits). The background shading represents the significance levels: p < 0.05, p < 0.01, and p < 0.001. (F) Dependence of the p-value on the update controller frequency vc for c = 0.025. Colors as in (E). (G) Black and red trace as in (E). Additionally, p-values for hardware-inspired synapses with common resets are plotted in yellow (r = 4 bits and n = 36) and magenta (r = 8 bits and n = 12). Compensations with ADCs are depicted in gray (r = 4 bits and n = 15–45 in steps of 2) and cyan (r = 8 bits and n = 1–46 in steps of 3).

