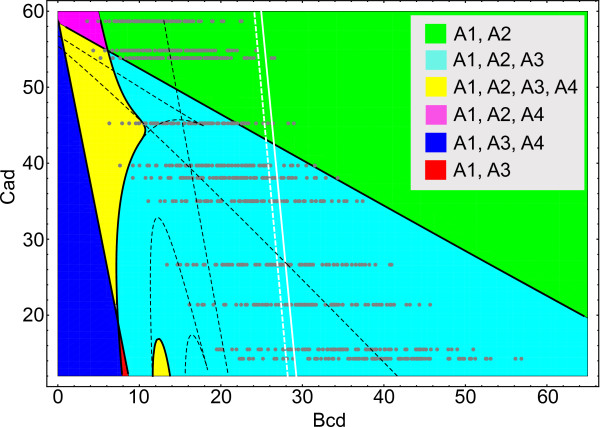
Figure 3.
The bifurcation diagram for the simplified model on the Bcd-Cad plane. The abscissa axis shows vBcd values in the equations, and the ordinate axis is for vCad values corresponding to the Cad concentrations at times after T6, when the model equations are autonomous. The colored regions are domains of existence for point attractors A1-A4, described symbolically in Table 1. The boundaries (black solid lines) delimiting these domains represent the positions of all bifurcations affecting the attractors. The black dashed lines show the positions of bifurcations affecting only saddle equilibria. The white dashed and solid lines are loci of points where the Gt concentration at attractor A1 equals 50 and 150, respectively. Therefore,  to the left of the white dashed line,
  to the right of the white solid line, and
  between the lines. The gray dots are the same as in Fig. 1B.

