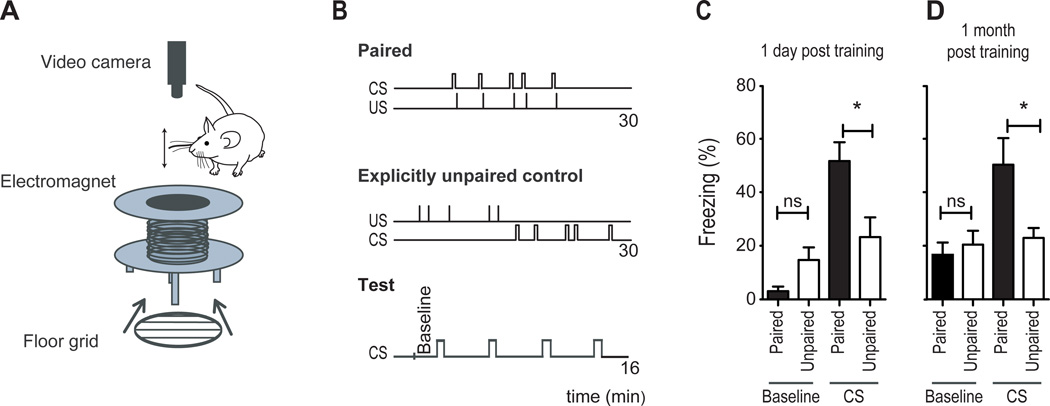
Figure 1. Fear conditioning by passive whisker stimulation.
(A) Schematic diagram showing the electromagnet used to passively deflect a whisker, the floor grid used to deliver foot-shock, and the camera used to track movement using FreezeFrame software. The mouse would be placed inside the bore of the magnet.
(B) Schematic diagram showing the order and timing of the CS and US in paired and unpaired training procedures and at the time of testing.
(C–D) Measurements of freezing in paired (black bars) and unpaired (open bars) conditioned mice during baseline and during CS, taken 1 day (C) or 1 month (D) after training; (ns non significant, *P<0.05, **P<0.01, ***P<0.001 Statistical analysis Student's t-test. Plots are mean ±SEM).

