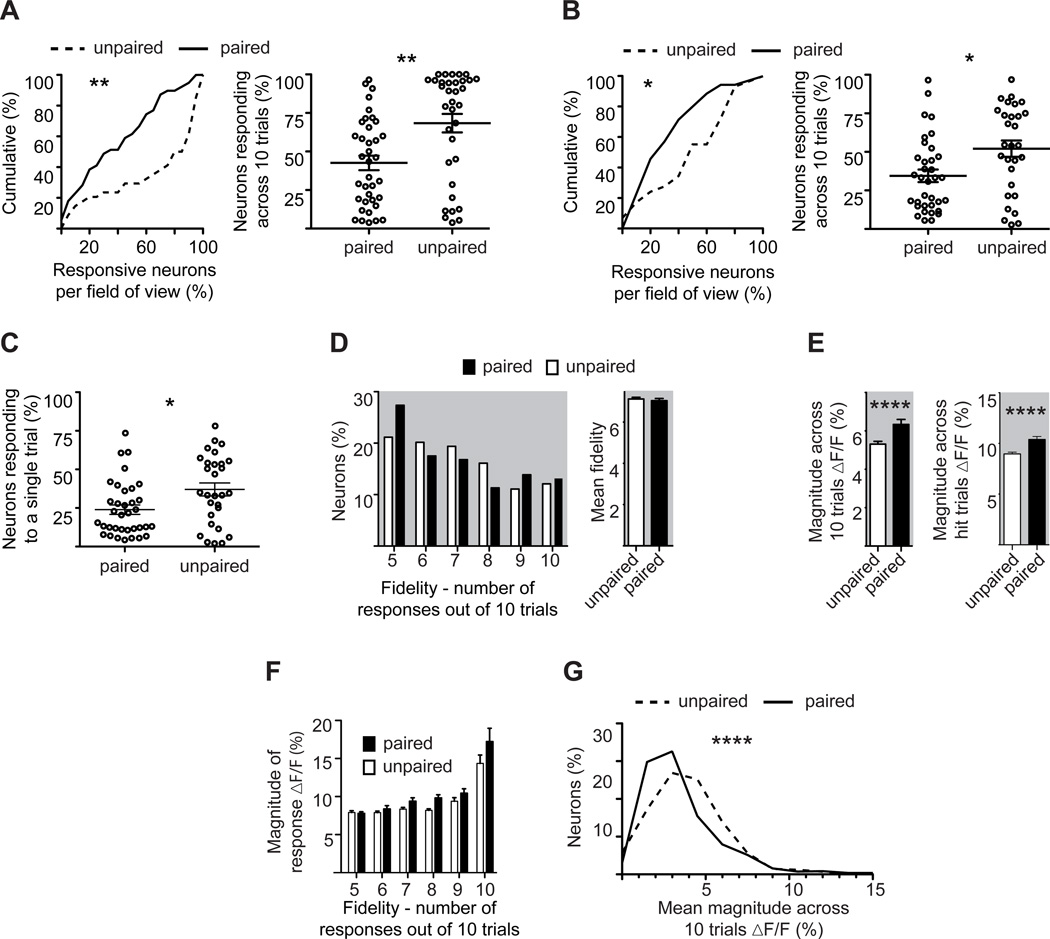
Figure 5. Associative fear learning increases both sparse population coding and response strength.
A. (Left) Cumulative percent of responding neurons across trials per field of view in paired (solid line) or unpaired (dashed line) mice. Responsive neurons were defined based on mean fluorescent change across 10 trials. (Right) Fractional response per field of view in paired and unpaired mice. Note the decreased fractional response after learning.
B. As in (A), but defining responsive neurons based on fidelity.
C. Percent of responsive neurons to a single stimulus trial per field of view in paired and unpaired mice.
D. Percent of responding neurons (defined as in (B)) plotted as a function of fidelity (left), and averaged fidelity (right). Note the absence of any significant change between paired (black bars) and unpaired (white bars) mice.
E. Mean fluorescence change of responding neurons measured in unpaired (white bars) and paired (black bars) mice across all 10 trials (left) or exclusive of failures (right). Note the significant increase in the paired group.
F. Mean response magnitude as a function of fidelity, exclusive of failures, for responsive neurons in paired (black bars) or unpaired (white bars) mice.
G. Percent of neurons, responsive and not, plotted as a function of their mean response magnitude, inclusive of failures, for paired (solid line) and unpaired (dashed line) mice. Note the reduction in the paired group.
(*P<0.05, **<0.01, ***P<0.001, ****P<0.0001. Statistical analysis, A–G: Mann-Whitney test). Plots are mean ±SEM.

