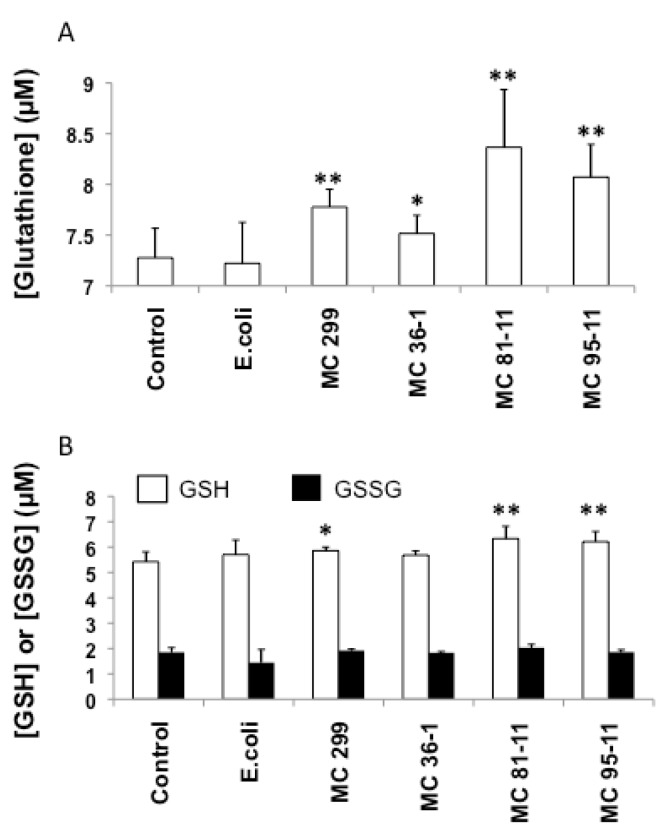
Figure 4.
Effects of LPS on total glutathione (A), and exclusive measurements of reduced (GSH, open columns) and oxidized (GSSG, black columns) glutathione (B) in 24 hpf zebrafish embryos. Embryos were exposed to cyanobacterial and heterotrophic bacterial LPS over a 24 h period. Columns represent the mean of six measurements. Error bars represent the standard deviation from the mean. An asterisk denotes a significant difference from the control (* denotes p < 0.05, and ** denotes p < 0.01).

