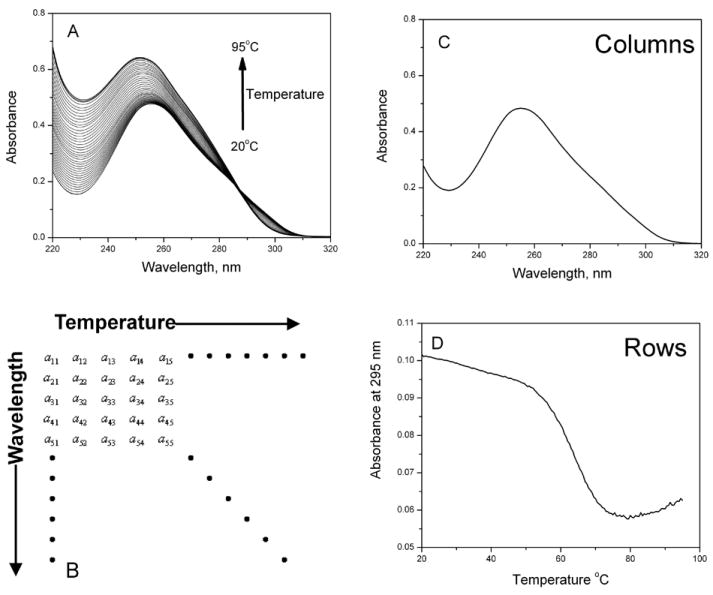
Figure 1.

Multidimensional melting data and the structure of data sets used for analysis. (A) Examples of UV spectra as a function of temperature. (B) Structure of the data matrix constructed from multidimensional melting data. (C) Columns of the data matrix show the UV spectrum at a single temperature. (D) Rows of the data matrix show the melting curve at a single wavelength.
