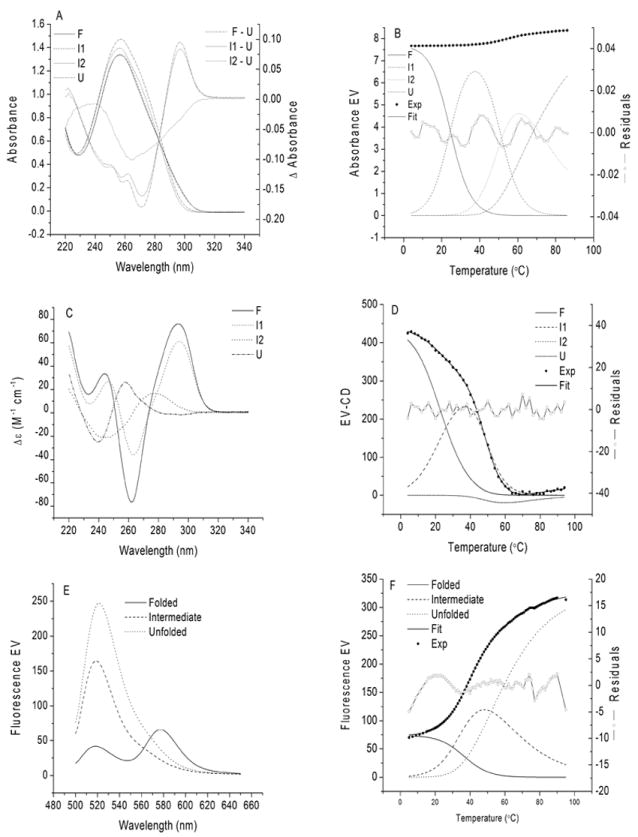
Figure 7.

Analysis of absorbance, CD and FRET data matrices of Figure 3 by GlobalWorks™. The absorbance and CD data were fit to a sequential four-state melting process F ↔ I1 ↔ I2 ↔ U where F and U represent the folded and unfolded states, and I1 and I2 are spectroscopic intermediates. EV = eigenvalue, which for the spectra corresponds directly to the measured spectroscopic parameter. For the species distribution plots in Panels B, D and F, EV is related to the relative contribution of each species to the total signal at the particular temperature. Also shown in Panels B, D and F is a comparison of the experimental data (•) and the best fit (solid line) calculated using the least-squares optimized parameters in Table 2. In addition, the distribution of residuals is shown (-o-).
