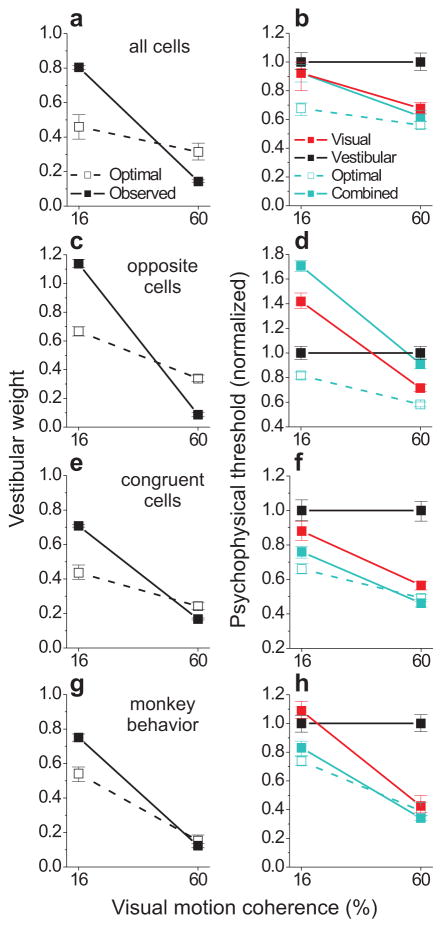
Figure 6.
Population decoding results and comparison with monkey behavior. Weights (left column, same format as Fig. 2a,b; from Eqs. 2 and 4) and thresholds (right column, same format as Fig. 2c,d; from Eq. 3 and psychometric fits to real or simulated choice data) quantifying the performance of an optimal observer reading out MSTd population activity. Thresholds were normalized by the value of the vestibular threshold, and the optimal prediction for the combined modality (cyan dashed lines and open symbols) was computed with Eq. 3. The population of neurons included in the decoder was varied in order to examine the readout of all cells (a,b), opposite cells only (c,d), or congruent cells only (e,f). Monkey behavioral performance (pooled across the two animals) is summarized in g,h. Error bars indicate 95% CIs.

