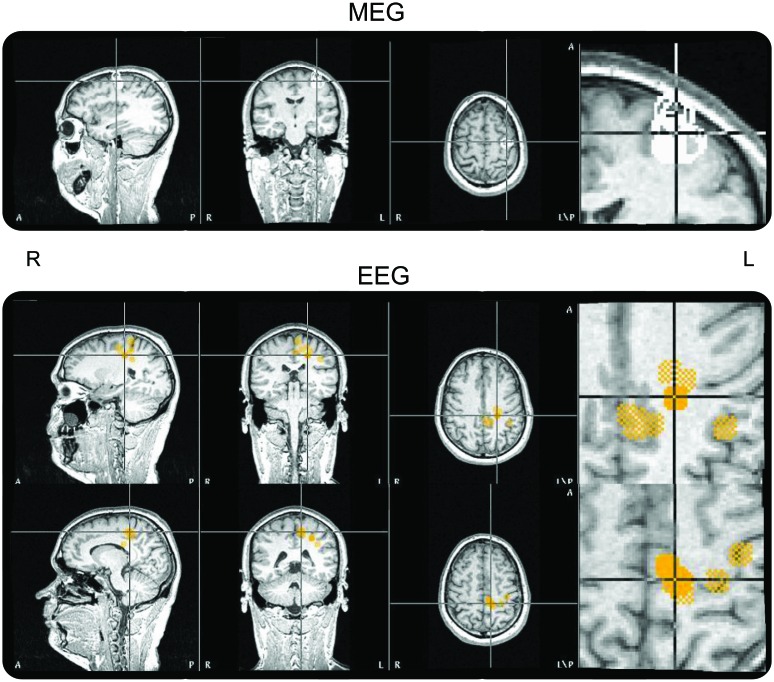
Figure 3. Simultaneous EEG and magnetoencephalography (MEG) results.
MEG source analysis (upper panel) overlaid on the subject's T1 image shows monofocal generation in the left precentral region. EEG source analysis (lower panel) overlaid on the subject's T1 image shows Brodmann area 6 sources extended more mesially.

