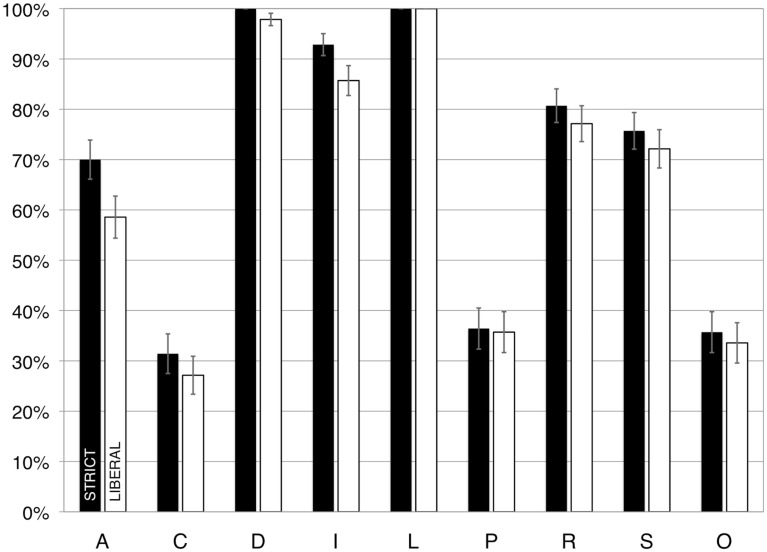
Figure 1.
The percentage of presentations that had violations, scored according to strict (dark bars) and liberal (light bars) criteria, in Study 1. A, appropriate knowledge; C, compatibility; D, discriminability; I, informative change; L, limited capacity; P, perceptual organization; R, relevance; S, salience; O, over-determined. Error bars illustrate the standard error of the mean.

