
Figure 4. Pulmonary Function in Patients with Lymphangioleiomyomatosis.
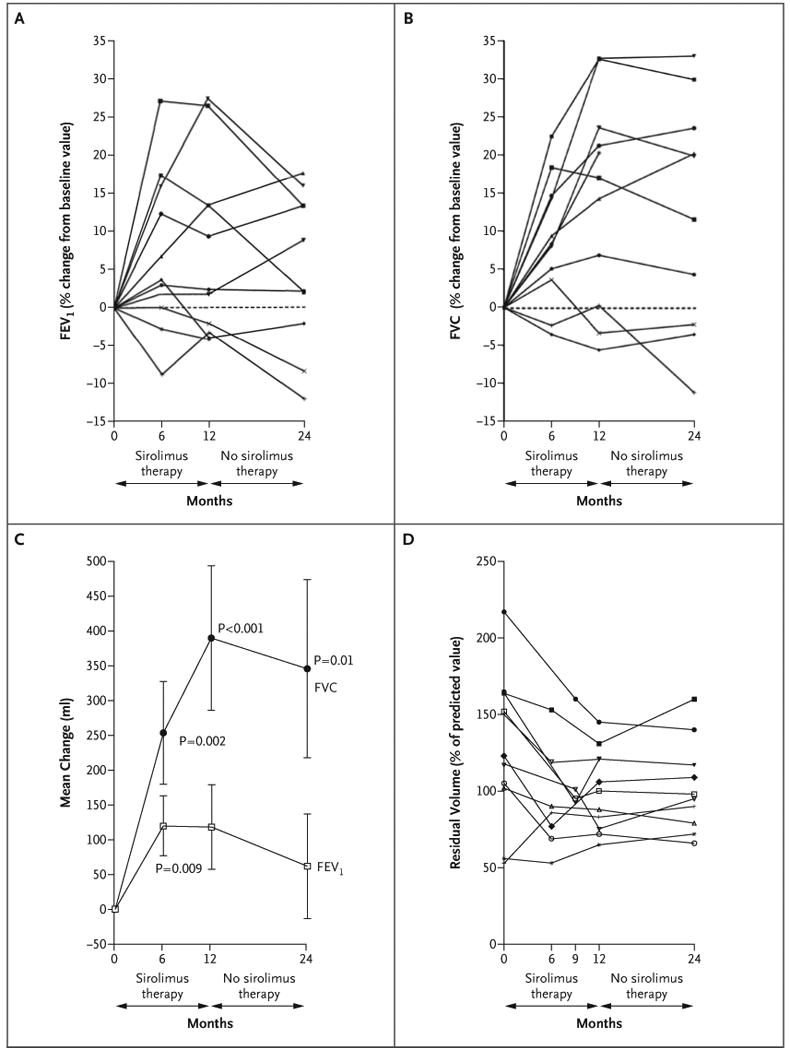
Panel A shows the forced expiratory volume in 1 second (FEV1) for each patient. Panel B shows the forced vital capacity (FVC) for each patient. Panel C shows the mean change (in milliliters) from the baseline values for FEV1 and for FVC. I bars indicate the standard errors. Panel D shows the residual volume for each patient.