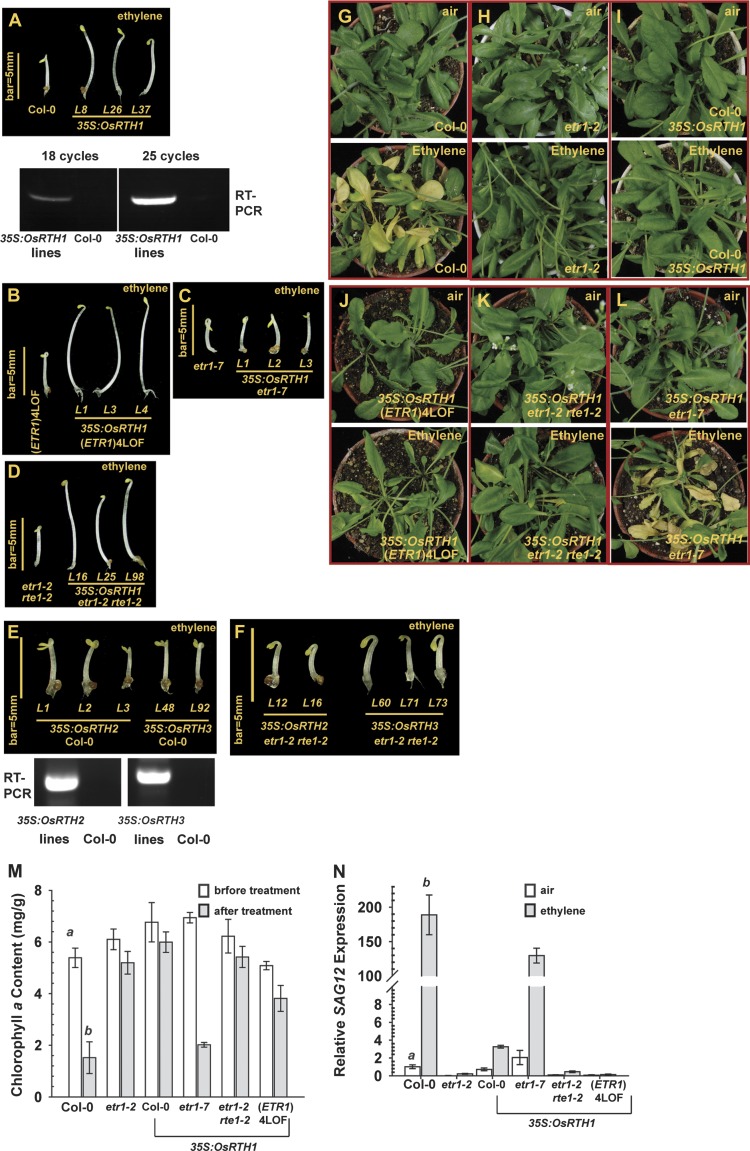
Fig. 2.
Functional analyses of plant RTHs in Arabidopsis. The seedling triple-response phenotype of ethylene-grown wild type (Col-0) and 35S:OsRTH1 transformation lines (A), (ETR1)4LOF and a mutant expressing 35S:OsRTH1 (B), etr1-7 and a mutant expressing 35S:OsRTH1 (C), and etr1-2 rte1-2 and a mutant expressing 35S:OsRTH1 (D). (E) The seedling triple-response phenotype of the wild type (Col-0) expressing 35S:OsRTH2 and 35S:OsRTH3. (F) Seedling triple-response phenotype of etr1-2 rte1-2 expressing 35S:OsRTH2 and OsRTH3. Leaf senescence phenotype of the wild type (Col-0) (G) and ethylene-insensitive etr1-2 (H); phenotype of wild type (Col-0), (ETR1)4LOF (J), etr1-2 rte1-2 (K), and etr1-7 (L) expressing 35S:OsRTH1. Air and ethylene indicate the phenotype of the same plants before and after the treatment, respectively. Chlorophyll a measurement (M) and SAG12 expression (N) of the wild type (Col-0), etr1-2, and 35S:OsRTH1 transformants in the corresponding mutation background as indicated. Error bars indicate the standard error (SE) for the means of five measurements. RT-PCR, analysis of the mRNA level of corresponding transgenes at the translational level. a (air) and b (ethylene) indicate a statistically significant difference (α=0.01) between the wild type and mutant or transformation lines.

