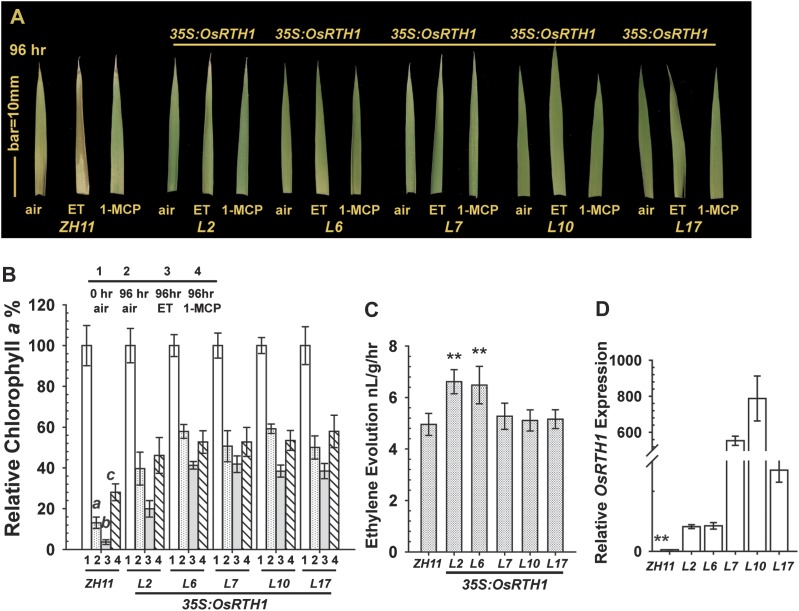
Fig. 4.
Rice leaf senescence test. (A) Senescence phenotypes of rice leaf in air, ethylene (ET), and 1-MCP. (B) Chlorophyll a content (%) relative to that before treatment (0 h). Data are the mean ±SD of five biological repeats. (C) Ethylene evolution of ZH11 and transformation rice lines. (D) Relative OsRTH1 expression in ZH11 and transformation rice lines (L). Data are the mean ±SD of each measurement. Ethylene, 100 μl l−1; 1-MCP, 5 μl l−1. a, b, and c, statistically significant difference (Fisher’s LSD, α=0.01) between the wild type (ZH11) and transformation rice lines for air (a), ethylene (ET, b), and 1-MCP (c) treatments. **Significant difference (Fisher’s LSD, α=0.01) among ZH11 and transformation rice lines.

