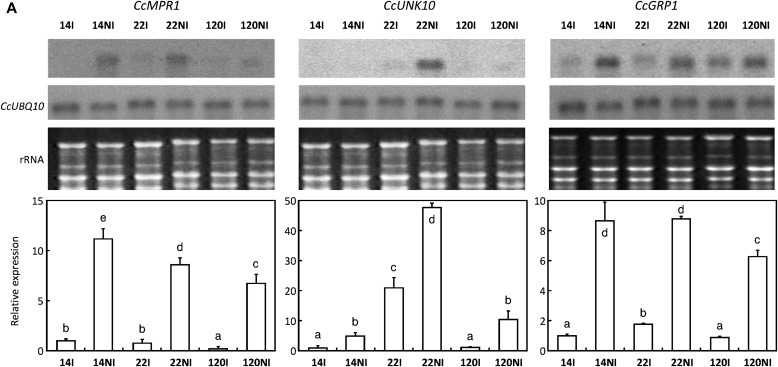
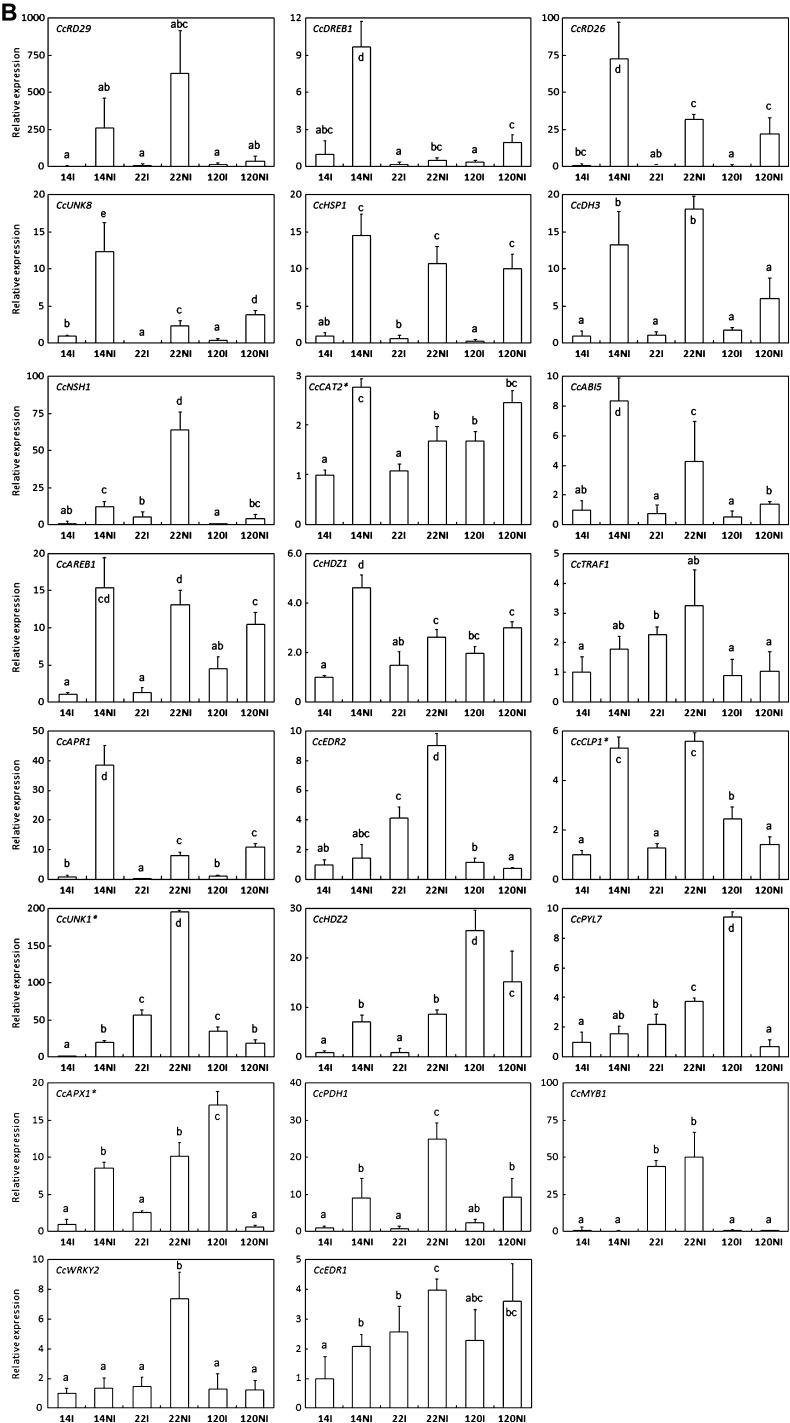
Fig. 6.
Expression profiles of genes up-regulated during drought acclimation. Gene expression was analysed in leaves of clones 14, 22, and 120 of C. canephora subjected (NI) or not (I) to drought. (A) Abundances of specific transcripts were analysed by northern blot and qPCR for CcMPR1, CcUNK10, and CcGRP1. For northern blot analyses, total RNA stained with ethidium bromide was used to monitor the equal loading of the samples. Constitutive expression of the CcUBQ10 gene is also shown. (B) For other genes, transcript abundances were analysed by qPCR. The expression of the CcUBQ10 gene was used as a reference to measure the relative quantification, except for the genes marked with an asterisk that used the expression of the CcGAPDH gene as reference. The gene names are indicated in the histograms. Results are expressed using 14I as an internal calibrator. In each case, values of relative quantification correspond to the mean of at least three technical repetitions ±SD. Significance of expression level differences between the treatments was evaluated using the pairwise Wilcoxon rank test (non-parametric test). Treatments sharing the same letter are not significantly different.


